USD/CAD Price Analysis: Retreats below 1.3200 on mixed technical indicators

- USD/CAD falls under 1.3200 as Canadian bond yields bolster CAD.
- Failure to break 1.3100 enables recovery, despite bearish RSI.
- USD/CAD’s recovery is reliant on reclaiming 1.3200, despite a bearish candle.
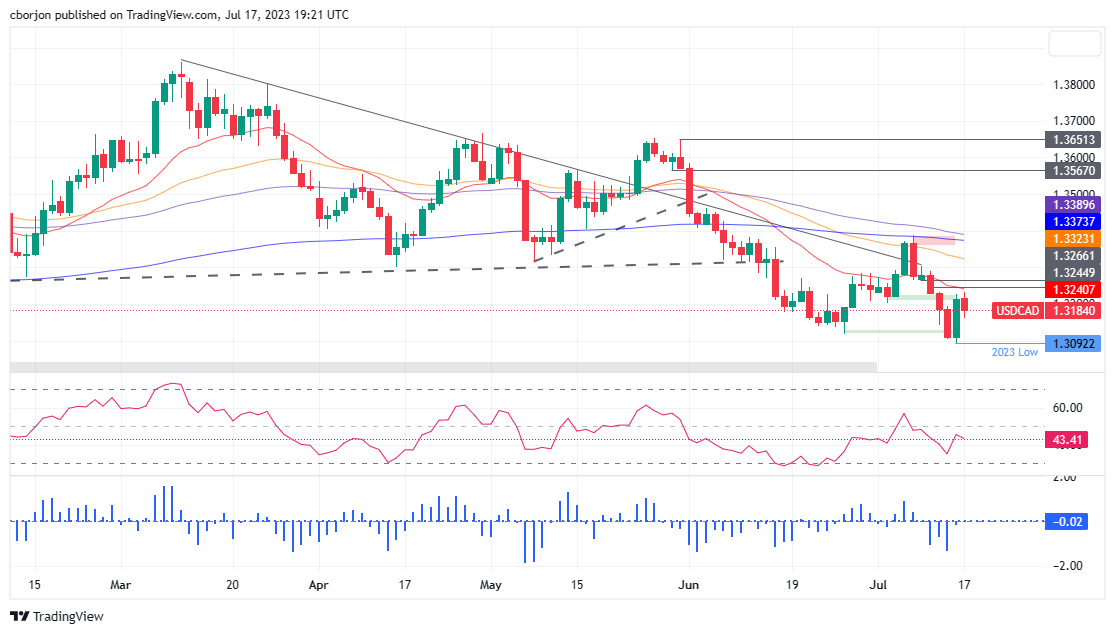
USD/CAD retreats below 1.3200 as the Canadian Dollar (CAD) gets underpinned by high Canadian bond yields, particularly the 10-year note at 3.385%, up 0.53%. In addition, the 20-day Exponential Moving Average (EMA), looming around the 1.3240 mark, was used by USD/CAD sellers to open fresh positions, weakening the pair. Therefore, the USD/CAD is trading at 1.3183, down 0.23%, after hitting a daily high of 1.3232.
USD/CAD Price Analysis: Technical outlook
From a technical perspective, the USD/CAD is downward biased, but failure to crack below the 1.3100 figure opened the door for recovery. After the USD/CAD printed a yearly low of 1.3092, the USD/CAD rallied towards 1.3220 before trimming some of those gains.
With the Relative Strength Index (RSI) aiming downwards at bearish territory would suggest that sellers remain in charge, except for the three-day Rate of Change (RoC), indicating that neither buyers/sellers are in control.
That said, if USD/CAD stays below 1.3200, first support emerges at 1.3150. A breach of the latter will expose the 1.3100 figure, followed by the year-to-date (YTD) low of 1.3092. Conversely, if USD/CAD buyers reclaim 1.3200, despite printing a bearish candle, that would expose the 20-day EMA at 1.3240. Once cleared, the USD/CAD would rally toward 1.3300, followed by the 50-day EMA at 1.3323, before testing the 200-day EMA at 1.3373.
