
Gold Price Forecast: XAU/USD upside appears more lucrative as US data looms – Confluence Detector
- Gold Price grinds higher past short-term key resistances while snapping three-day downtrend.
- China-linked headlines underpin firmer sentiment, XAU/USD upside.
- US Retail Sales, Industrial Production can guide short-term Gold Price moves ahead of July Fed meeting.
Gold Price (XAU/USD) cheers the return of risk-on mood as traders reassess previous fears emanating from China. Adding strength to sentiment, as well as the XAU/USD price, is the US Dollar’s failure to defend late Friday’s recovery amid unimpressive data. With this, the Gold buyers flex their muscles for another fight to regain the $2,000 round figure.
Apart from the fresh catalysts suggesting the dragon nation’s capacity to defend economic growth, headlines suggesting the restoration of the US-China ties also underpin the market’s cautious optimism. Elsewhere, the US NY Empire State Manufacturing Index failed to impress US Dollar bulls, despite Friday’s upbeat consumer-centric figures.
Elsewhere, hopes of witnessing more stimulus from China and challenges for restrictive monetary policies also allow the Gold Price to remain firmer.
Moving on, US Retail Sales and Industrial Production for June will be crucial to determine the Fed’s rate hike trajectory past July and can help gauge the Gold Price moves.
Also read: Gold Price Forecast: XAU/USD looks to $1,968 and US Retail Sales for fresh Fed cues
Gold Price: Key levels to watch
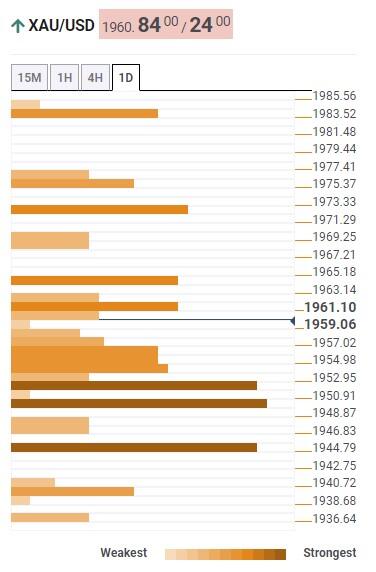
Our Technical Confluence Indicator shows that the Gold Price recently crossed the key resistances and has softer hurdles toward the north than otherwise.
That said, a convergence of the previous weekly high and upper band of the Bollinger on the four-hour play highlights immediate resistance near $1,965.
Following that, the Pivot Point one-month R1 can prod the XAU/USD bulls around $1,975 before directing them to the $1,985 resistance confluence encompassing the previous monthly high.
On the flip side, the 50-DMA level of around $1,951 limits the immediate downside of the Gold Price.
Adjacent to that is the convergence of the Fibonacci 61.8% on one month and 23.6% on one day, near $1,950.
It’s worth noting that Fibonacci 38.2% on one week, near $1,945, acts as the last defense of the XAU/USD bulls.
Here is how it looks on the tool
About Technical Confluences Detector
The TCD (Technical Confluences Detector) is a tool to locate and point out those price levels where there is a congestion of indicators, moving averages, Fibonacci levels, Pivot Points, etc. If you are a short-term trader, you will find entry points for counter-trend strategies and hunt a few points at a time. If you are a medium-to-long-term trader, this tool will allow you to know in advance the price levels where a medium-to-long-term trend may stop and rest, where to unwind positions, or where to increase your position size.