Silver Price Analysis: XAG/USD holds to gains above @$25.00 as rising-wedge looms

- Four days of steady upward momentum on the daily chart, with XAG/USD consolidating around the $24.50-$25.20 zone.
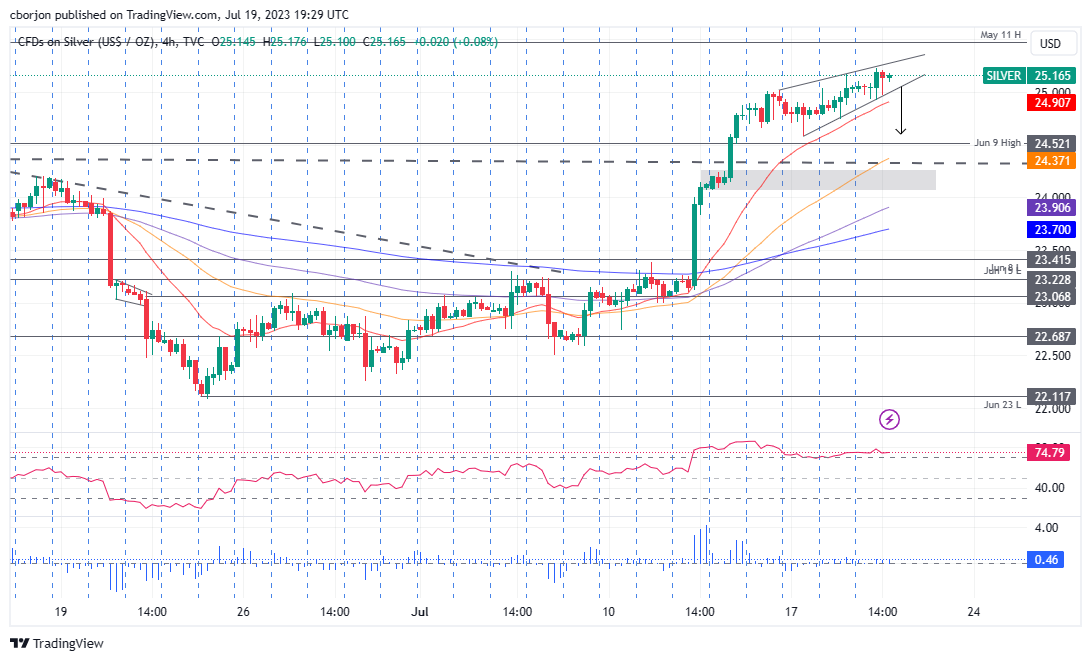
- The 4-hour chart signals a potential pullback, forming a rising wedge with the 20-EMA offering possible support at around $24.95.
- Resistance lies at the May 11 high of $25.47 and the May 10 high of $25.91. Should XAG/USD fall, support can be found at $25.00, $24.95 (20-EMA), and $24.52 (June 9 high).
Silver price achieves modest gains on Wednesday amid falling US Treasury bond yields despite overall US Dollar (USD) strength across the FX board. Soft US housing data, and yesterday’s mixed Retail Sales figures, boosted the USD. That said, the XAG/USD is trading at $25.14, above its opening price by 0.34%.
XAG/USD Price Analysis: Technical outlook
The XAG/USD daily chart portrays the white metal as upward biased, rising steadily during the last four days after the July 13 rally of almost 3%. Since then, the XAG/USD has remained at around the $24.50-$25.20 area, consolidating ahead of testing strong resistance at the May 11 daily high of $25.47, ahead of the XAG/USD’s reaching the year-to-date (YTD) high of $26.13.
From an intraday perspective, the XAG/USD 4-hour chart portrays the pair as upward biased but forming a rising wedge, which could pave the way for a pullback. Still, the presence of the 20-Exponential Moving Average (EMA) at around $24.95 tracks XAG/USD price action and might cap Silver’s fall, once it breaks out.
The XAG/USD first support would be the $25.00 figure. Once cleared, the next support would be the 20-EMA at $24.95, followed by the June 9 daily high at $24.52. A breakout below that level would expose a strong support area at around $24.00/25.
Conversely, if XAG/USD rallies past the top of the rising wedge, the following supply area would be the May 11 daily high at $25.47, followed by the May 10 high at $25.91.
