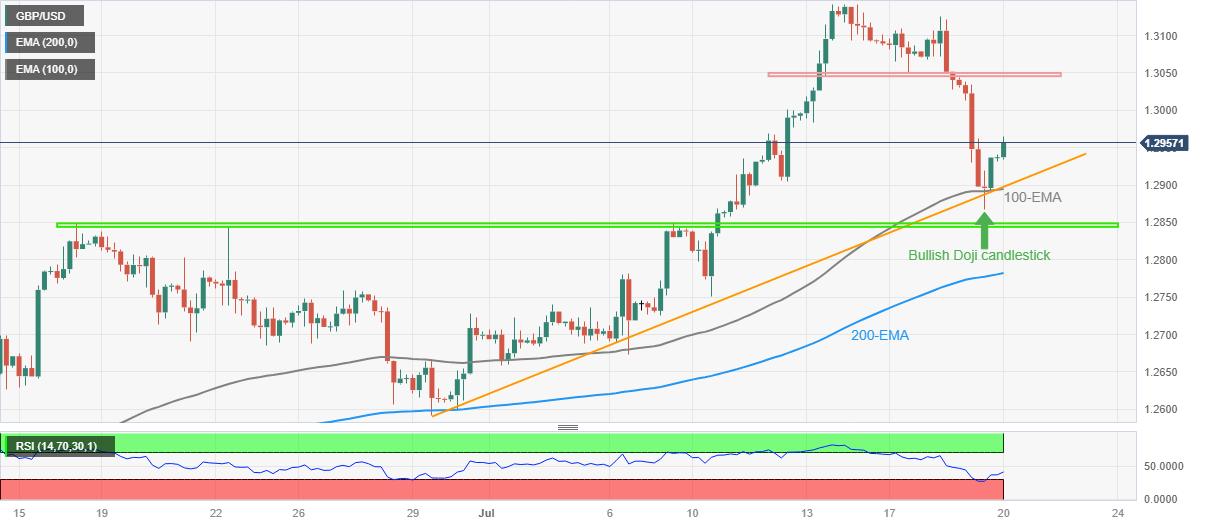
GBP/USD Price Analysis: Cable looks set to regain 1.3000 as technical details favor bulls

- GBP/USD reverses from one-week low, snaps four-day losing streak.
- Bullish candlestick, U-turn from key support confluence and RSI’s rebound from oversold territory favor Cable bulls.
- Pound Sterling weakness appears elusive beyond 200-EMA; five-week-old horizontal support will also prod sellers.
GBP/USD remains on the front foot around the intraday high of near 1.2965 amid early Thursday morning in London, snapping a four-day downtrend while reversing from the lowest levels in seven days. In doing so, the Cable pair justifies multiple technical signals which favor the bullish bias about the Pound Sterling price.
Among them, Wednesday’s bullish Doji candlestick at the weekly low gains major attention as it prevails at the convergence of the 100-bar Exponential Moving Average (EMA) and a three-week-long rising support line. Adding strength to the upside bias is the RSI (14) line’s rebound from the oversold region.
With this, the GBP/USD price appears well-set to regain the 1.3000 round figure. However, a horizontal area comprising lows marked during the mid-July, around 1.3045-50 may prod the pair buyers afterward.
In a case where the Cable pair remains firmer past 1.3050, the odds of witnessing a run-up toward the monthly high of 1.3142 can’t be ruled out.
On the contrary, a successful downside break of the 1.2895-90 support confluence, comprising the multi-day-old rising support line and the 100-EMA, can please the intraday sellers but may not term the GBP/USD pair as bearish as a five-week-old horizontal area near 1.2850 can prod the sellers.
Apart from the 1.2850 support, the 200-EMA level of around 1.2780 also acts as the final defense of the GBP/USD bulls.
GBP/USD: Four-hour chart
Trend: Further upside expected
