AUD/USD Price Analysis: Bears approach 0.6730 confluence level on breaking nearby support

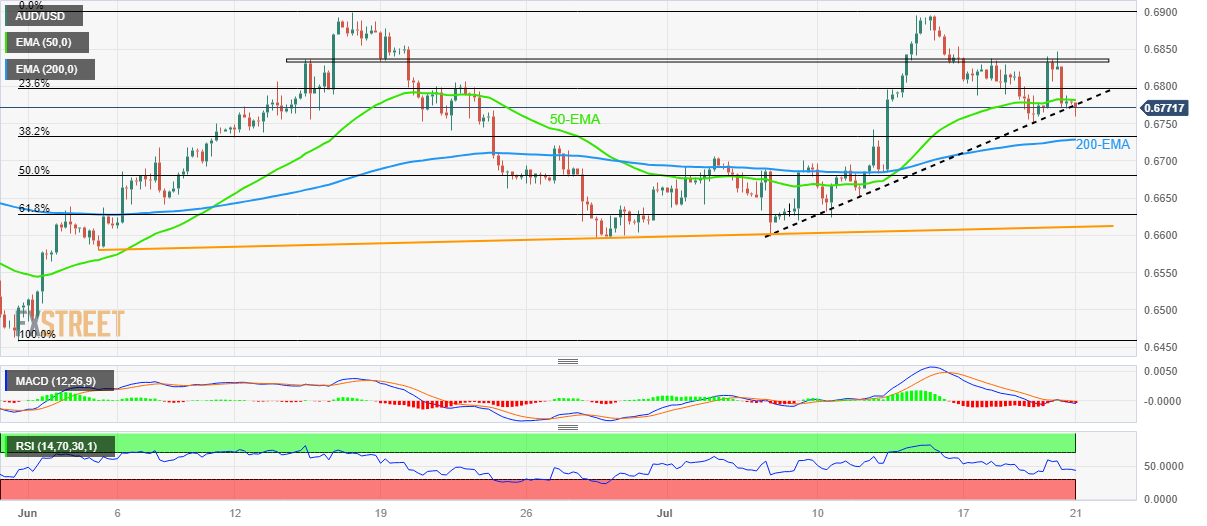
- AUD/USD slides beneath 50-EMA, fortnight-old support line to lure sellers.
- Downbeat oscillators, trend line break direct Aussie bears toward convergence of 200-EMA, 38.2% Fibonacci retracement.
- Five-week-long horizontal region, double tops around 0.6900 act as additional upside filters.
AUD/USD prints mild losses around 0.6775-70 as it reverses the previous day’s corrective bounce amid Friday’s Asian session.
The Aussie pair’s latest weakness could be linked to the downside break of the 50-bar Exponential Moving Average (EMA) and a two-week-long rising support line. Adding strength to the downside bias is the market’s cautious mood, as well as bearish MACD signals and a steady RSI (14) line.
With this, the AUD/USD bears appear well set to target the 0.6730 support confluence comprising the 200-EMA and 38.2% Fibonacci retracement of its May 31 to June 16 upside.
However, the quote’s downside past 0.6730 has multiple supports to conquer before convincing the bears. Among them, an upward-sloping trend line from June 05, near 0.6610 at the latest, gains major attention.
On the flip side, the support-turned-resistance and the 50-EMA, around 0.6780 by the press time, restrict the immediate upside of the AUD/USD pair.
Following that, a horizontal area comprising multiple levels marked since mid-June, near 0.6830-35, will be an important hurdle to watch for the bulls.
Above all, the double tops around 0.6900 appears a tough nut to crack for the Aussie pair buyers.
AUD/USD: Four-hour chart
Trend: Further downside expected
