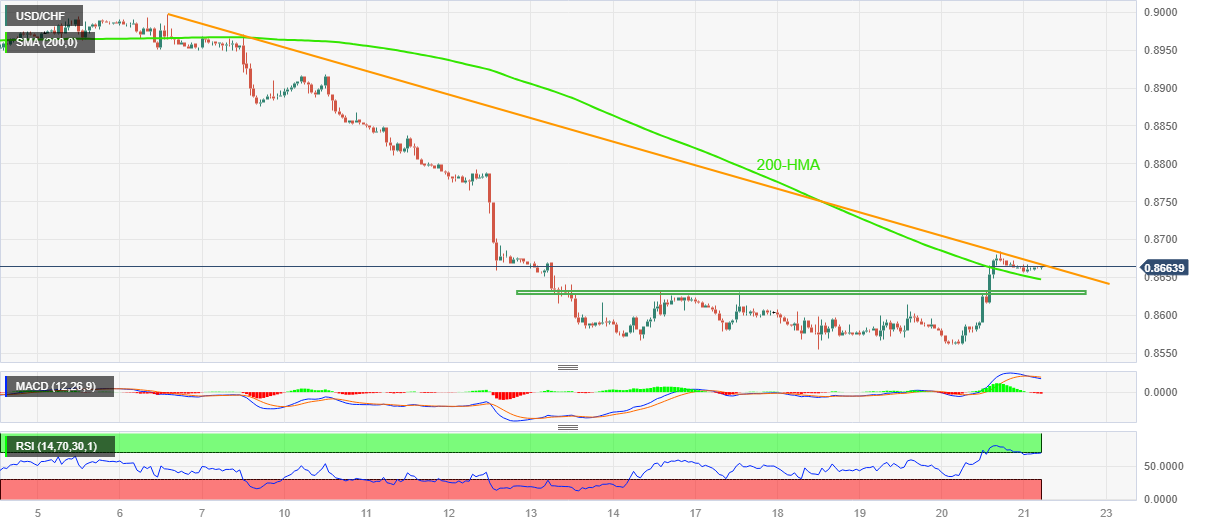
USD/CHF Price Analysis: Grinds between 200-HMA and fortnight-old resistance line below 0.8700

- USD/CHF edges higher during the first positive week, so far, in four despite snapping two-day uptrend.
- Overbought RSI, bearish MACD signals join short-term key resistance line to challenge pair buyers.
- 200-HMA, one-week-old horizontal region provide headwinds to Swiss Franc pair sellers.
USD/CHF treads water as it seesaws within a small trading range of around 15 pips above 0.8655 heading into Friday’s European session.
In doing so, the Swiss Franc (CHF) pair remains sidelined between the 200-Hour Moving Average (HMA) and a two-week-long downward-sloping resistance line. With this, the major currency pair braces for the first weekly gain in four, despite snapping a two-day winning streak with mild losses of late.
It’s worth noting that the overbought RSI and bearish MACD signals suggest the market favors the USD/CHF sellers. However, a clear break of the 200-HMA level of 0.8647 becomes necessary to convince the bears.
Even so, a horizontal area comprising multiple levels marked since July 13, close to 0.8630-25, can challenge the USD/CHF sellers before directing them to the multi-year low marked earlier in the week around 0.8555. During the likely fall, the 0.8600 round figure may act as an intermediate halt.
Meanwhile, an upside clearance of the falling resistance line stretched from July 06, near 0.8670 at the latest, will need validation from the weekly high of around 0.8685, as well as the 0.8700 round figure to convince USD/CHF buyers.
In a case where the USD/CHF stays firmer past 0.8700, the July 12 swing high of near 0.8795 and the 0.8800 will be on the bull’s radar.
USD/CHF: Hourly chart
Trend: Pullback expected
