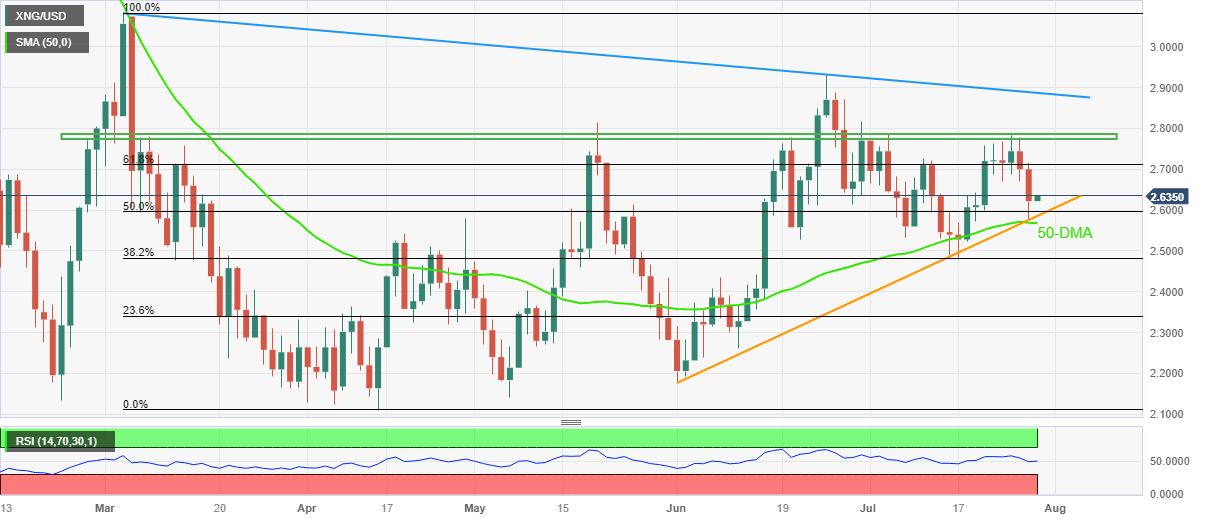
Natural Gas Price Analysis: XNG/USD bounces off key support to reclaim $2.60 ahead of Fed inflation

- Natural Gas Price picks up bids to recover from weekly low, snaps two-day losing streak.
- Two-month-old rising support line prods XNG/USD bears as US Dollar stabilizes ahead of Core PCE Price Index data.
- 50-DMA, steady RSI also favor Natural Gas recovery as market awaits Fed’s preferred inflation gauge.
- Five-month-old horizontal resistance, descending trend line from March appear strong challenges for the XNG/USD bulls.
Natural Gas Price (XNG/USD) clings to mild gains around $2.63 during the mid-Asian session on Friday. In doing so, the XNG/USD prints the first daily gains in three while bouncing off the weekly low.
That said, the energy instrument dropped the most in more than a fortnight the previous day amid the broad US Dollar strength.
The XNG/USD downside, however, failed to conquer an upward-sloping support line from late May, around $2.58 by the press time.
It should be noted that the steady RSI (14) and the 50-DMA challenge the Natural Gas sellers unless the quote provides a daily closing beneath the $2.56 level.
Following that the 38.2% Fibonacci retracement of the March-April downside, near $2.48, will be in the spotlight before directing the XNG/USD bears toward the previous monthly low surrounding $2.17.
On the contrary, the 61.8% Fibonacci retracement level of $2.71 guards the immediate upside of the Natural Gas price ahead of a five-month-old horizontal resistance surrounding $2.78.
Even if the XNG/USD crosses the $2.78 hurdle, a downward-sloping resistance line from March, close to $2.89 by the press time, will act as the last defense of the bears.
Natural Gas Price: Daily chart
Trend: Limited recovery expected
