
S&P 500 starts week flat ahead of big-tech earnings, US employment data
- Despite a backlash on Thursday, S&P 500 gained 1.01% last week.
- S&P 500 reaches 4,590 to 4,637 resistance zone.
- The index has gained for nine of the last 11 weeks.
- July US Nonfarm Payrolls will be released on Friday.
- Amazon, Apple, Merck, AMD release quarterly results this week.
The S&P 500 remains flat footed on Monday despite SoFi (SOFI) earnings pushing that neobank up more than 18% at the start of trading. The tech-focused NASDAQ Composite is also flattish at the time of writing, with the more value-oriented Dow Jones Industrial Index also making slight gains.
The S&P 500 added 1.01% last week despite experiencing a serious plunge last Thursday. The much-watched index has now advanced in nine of the past 11 weeks and seems poised to keep going despite technical indicators calling it overbought.
A flurry of major components of the index will release their second-quarter results this week, including Apple (AAPL), Amazon (AMZN) and Advanced Micro Devices (AMD). Additionally, the week will see the release of US Nonfarm Payrolls data for July.
At the time of writing in Monday’s premarket, S&P 500 futures – as well as NASDAQ 100 and Dow Jones futures – are ahead 0.15%.
S&P 500 News: Apple, Amazon arrive on Thursday
Apple and Amazon are the biggest firms reporting this week. As luck has it, both release calendar Q2 results on Thursday – making that day the primary focus for many traders.
Nearly half of the companies in the S&P 500 have already released their results over the past three weeks, and the news for investors has been quite positive to date. There is a clear trend in place. About 81% of reporting firms thus far have beaten their earnings consensus, while just 62% of firms have beaten revenue consensus forecasts.
From a Societe Generale client note: “Surprise factor: average EPS beat of 5.8% vs sales beat of 1.3%; margins have surprised, most likely driven by cost cuts and potentially also interest income […].”
Hence, while overall sales appear to be down, margins have outperformed Wall Street analysts and given a boost to profitability writ large. Tech, communications and consumer-focused firms have performed the best this quarter, while banks and other financials are underperforming.
Analysts have put out a quite mixed response for Apple’s upcoming earnings. Revisions to earnings per share (EPS) have been upward in 10 instances and down in 16 instances over the past 90 days. Wall Street expects Apple to earn $1.19 per share on revenue of $81.82 billion when it reports after the close on Thursday.
Amazon has received vastly more upward revisions to earnings forecasts than downward revisions over the past 90 days. Analyst consensus is at $0.34 a share on $131.34 billion in sales.
Nonfarm Payrolls expected to reach 200k on Friday
July’s US Nonfarm Payrolls (NFP) data will tell the equity market whether job hiring is continuing to slow down. June saw 209,000 new hires, which was well below the 225,000 figure that economists expected but still healthy.
For July, economists expect the NFP to arrive at 200,000. The market will most likely react positively to a lower number since it would give more weight to the belief that the Federal Reserve is already getting what it wants and, thus, will decide not to raise rates at its September policy meeting.
The central bank raised interest rates by 25 basis points last week, but the equity market responded well since Fed Chair Jerome Powell seemed wishy-washy concerning any future hikes this year. The CME FedWatch Tool now gives just a 20% chance of a 25 bps hike in September, and many pundits think the long rate-hiking cycle may really be over.
Still, a higher NFP number may lead enough traders to begin trimming their positions since a tight labor market could conjure further inflation ahead. Traders will also pay attention to Average Hours Earnings in the report, which consensus expects to drop from last month’s 4.4% YoY reading to 4.2% YoY.
Earnings of the week
Monday, July 31 – Western Digital (WDC), Arista Networks (ANET), Yum China (YUMC)
Tuesday, August 1 – Merck (MRK), Pfizer (PFE), Advanced Micro Devices (AMD), Caterpillar (CAT), Starbucks (SBUX), Uber (UBER), and Altria (MO).
Wednesday, August 2 – CVS Health (CVS), Shopify (SHOP), PayPal (PYPL), Kraft Heinz (KHC), Humana (HUM)
Thursday, August 3 – Apple (AAPL), Amazon (AMZN), Amgen (AMGN), AirBNB (ABNB)
Friday, August 4 – Enbridge (ENB), Dominion Energy (D), fuboTV (FUBO)
What they said about the market – Michael Wilson
Morgan Stanley equity strategist Michael Wilson is a noted bear, but even he is suggesting that 2023 looks a whole lot like 2019. That was a banner year for the index when the S&P 500 returned 29%. Wilson says the Fed pausing rate hikes and then trimming helped equities in 2019 – a similar pattern to what is happening this year.
“The data we have today suggests to us that we are in a policy-driven, late-cycle rally.”
S&P 500 FAQs
The S&P 500 is a widely followed stock price index which measures the performance of 500 publicly owned companies, and is seen as a broad measure of the US stock market. Each company’s influence on the computation of the index is weighted based on market capitalization. This is calculated by multiplying the number of publicly traded shares of the company by the share price. The S&P 500 index has achieved impressive returns – $1.00 invested in 1970 would have yielded a return of almost $192.00 in 2022. The average annual return since its inception in 1957 has been 11.9%.
Companies are selected by committee, unlike some other indexes where they are included based on set rules. Still, they must meet certain eligibility criteria, the most important of which is market capitalization, which must be greater than or equal to $12.7 billion. Other criteria include liquidity, domicile, public float, sector, financial viability, length of time publicly traded, and representation of the industries in the economy of the United States. The nine largest companies in the index account for 27.8% of the market capitalization of the index.
There are a number of ways to trade the S&P 500. Most retail brokers and spread betting platforms allow traders to use Contracts for Difference (CFD) to place bets on the direction of the price. In addition, that can buy into Index, Mutual and Exchange Traded Funds (ETF) that track the price of the S&P 500. The most liquid of the ETFs is State Street Corporation’s SPY. The Chicago Mercantile Exchange (CME) offers futures contracts in the index and the Chicago Board of Options (CMOE) offers options as well as ETFs, inverse ETFs and leveraged ETFs.
Many different factors drive the S&P 500 but mainly it is the aggregate performance of the component companies revealed in their quarterly and annual company earnings reports. US and global macroeconomic data also contributes as it impacts on investor sentiment, which if positive drives gains. The level of interest rates, set by the Federal Reserve (Fed), also influences the S&P 500 as it affects the cost of credit, on which many corporations are heavily reliant. Therefore, inflation can be a major driver as well as other metrics which impact the Fed decisions.
S&P 500 forecast
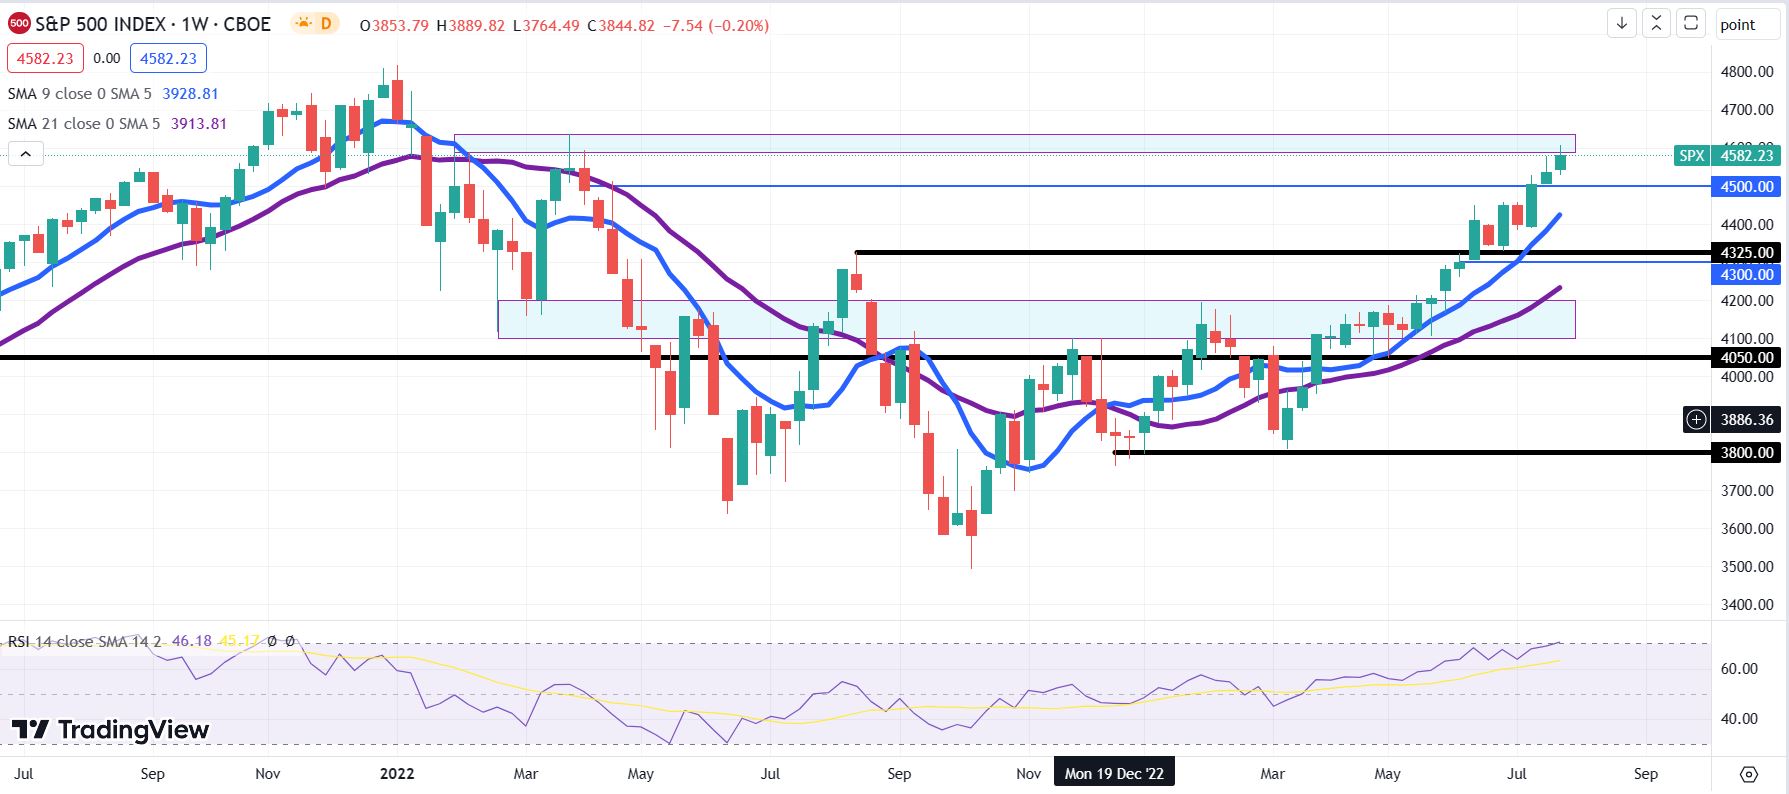
The S&P 500 has reached the 4,590 to 4,637 resistance zone that pushed the index lower back in February and March of 2022.
The Relative Strength Index (RSI) has reached 70 or the overbought stage on the weekly chart below, though bulls will note that the S&P 500 index has been largely overbought on the daily chart since early June. That said, it is still not safe to ignore. The last time the RSI reached 70 on the weekly chart in late November of 2021, the index followed one month later with the beginning of its -27%, 10-month decline.
A break above 4,637 will have bulls pounding the table for a retest of the all-time high at 4,818. In case Michael Wilson’s worries come to fruition, support sits at 4,500 and 4,325.
S&P 500 weekly chart