
Dax higher high sequence supports more upside [Video]
Short Term Elliott Wave view in DAX suggests that a index ended wave (3) at 16427.42 high. Down from there, the index made a pullback in wave (4). The internals of that pullback unfolded as a zigzag correction where wave A ended at 15713.70 low. Up from there, the wave B bounce ended at 16209.29 high in a lesser degree 3 wave. And started the C leg lower towards 15494.55- 15054.13 extreme area. From there, the index started the next extension higher & now showing an incomplete sequence within the cycle from the 7.07.2023 low supporting more upside.
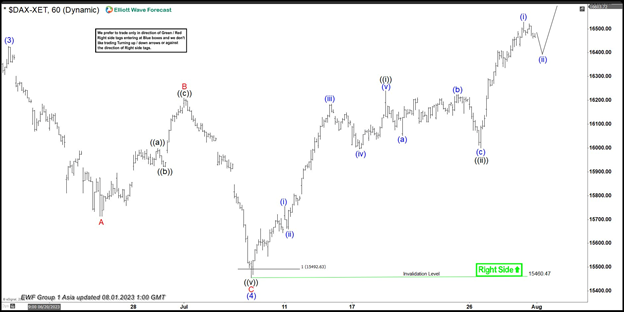
Dax 1 hour Elliott Wave chart from 8.01.2023
The index ended wave (4) at 15460.47 low and above from there already made a new high above 16427.42 high confirming the next extension higher. While the initial rally to 16240.79 high ended the impulse rally in wave ((i)) in a lesser degree 5 waves sequence. Below from there, the index made a 3 wave pullback in wave ((ii)) as a lesser degree zigzag structure. When small wave (a) ended at 16050.98 low. Then small wave (b) bounce ended at 16225.89 high and wave (c) ended at 16000.04 low. Then index started the next leg higher suggesting a possible nesting higher. Near-term, as far as dips remain above $16000.04 low and more importantly above 16427.42 low the index is expected to remain supported in 3, 7 or 11 swings looking for more upside towards 16785- 17272 area.