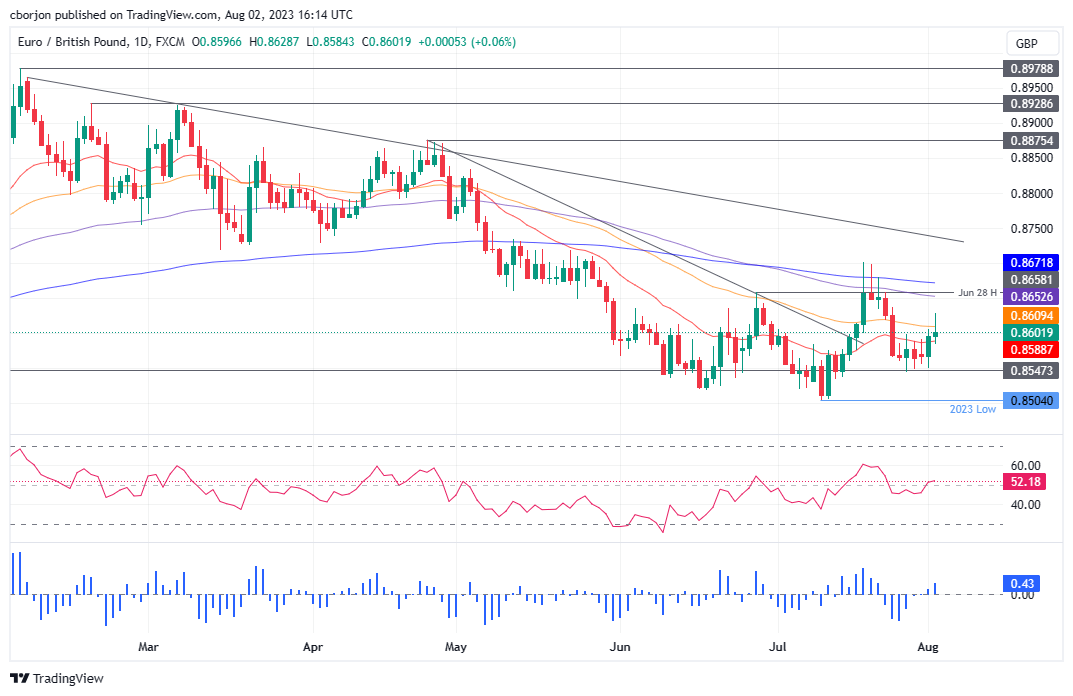
EUR/GBP Price Analysis: Struggles at 50-day EMA, despite buyers stepping in

- EUR/GBP remains neutral to downward biased, with strong resistance at around 0.8650/75, potentially hindering buyers’ attempts to reach 0.8700.
- If the pair breaks above 0.8675, it may target 0.8700, followed by a seven-month-old downslope resistance trendline around 0.8730/50.
- A daily close below the 50-day EMA at 0.8609 could open the way for a drop toward last week’s low of 0.8544 or the YTD low of 0.8504.
The EUR/GBP extends its gains to two consecutive days but faces solid resistance at around 0.8630, with the EUR/GBP pair dropping below the 50-day Exponential Moving Average (EMA) at 0.8609. At the time of writing, the EUR/GBP exchanges hands at 0.8607, gaining 0.12% after reaching a low of 0.8584.
EUR/GBP Price Analysis: Technical outlook
The EUR/GBP daily chart portrays the pair as neutral to downward biased, despite the recent lower low being above the year-to-date (YTD) low of 0.8504 at 0.8544 but strong resistance at 0.8650/75, which could cap buyers’ attempts to reach the 0.8700 figure in the near term.
If EUR/GBP breaks above 0.8675, the next supply zone would be 0.8700. A breach of the latter will expose a seven-month-old downslope resistance trendline at around 0.8730/50, followed by a rally to 0.8800.
On the other hand, if EUR/GBP prints a daily close below the 50-day EMA at 0.8609, that could open the door for a break below the 0.8600 mark. The following support would be the 20-day EMA at 0.8689, followed by the last week’s low of 0.8544, ahead of the YTD low of 0.8504.
Oscillator-wise, the Relative Strength Index (RSI) turned bullish, while the three-day Rate of Change (RoC) suggests buyers are entering the market. However, they must reclaim solid resistance levels if they would like to extend their gains toward the 0.8700 figure.
