
EUR/JPY Price Analysis: Retraces from weekly highs above 157.00 on risk-off
- EUR/JPY retraces from the weekly high of 157.50, falling past 157.00, trading at 156.78, failing to test the YTD high of 157.99.
- Japanese Yen’s strength is attributed to the Bank of Japan’s Yield Curve Control flexibility and a downgrade of US creditworthiness from AAA to AA+.
- Technicals show a peak around the 156.80/157.40 area, with bearish signals from the Tenkan-Sen, Kijun-Sen, and Chikou Span.
EUR/JPY retraces from weekly highs of 157.50 and drops below 157.00 as buyers failed to extend their gains and test the year-to-date (YTD) high of 157.99. The reasons behind the Japanese Yen (JPY) strength are the Yield Curve Control (YCC) flexibility imposed by the Bank of Japan (BoJ), as well as the downgrade of US creditworthiness from AAA to AA+. Therefore, the EUR/JPY tumbled and is trading at 156.78.
EUR/JPY Price Analysis: Technical outlook
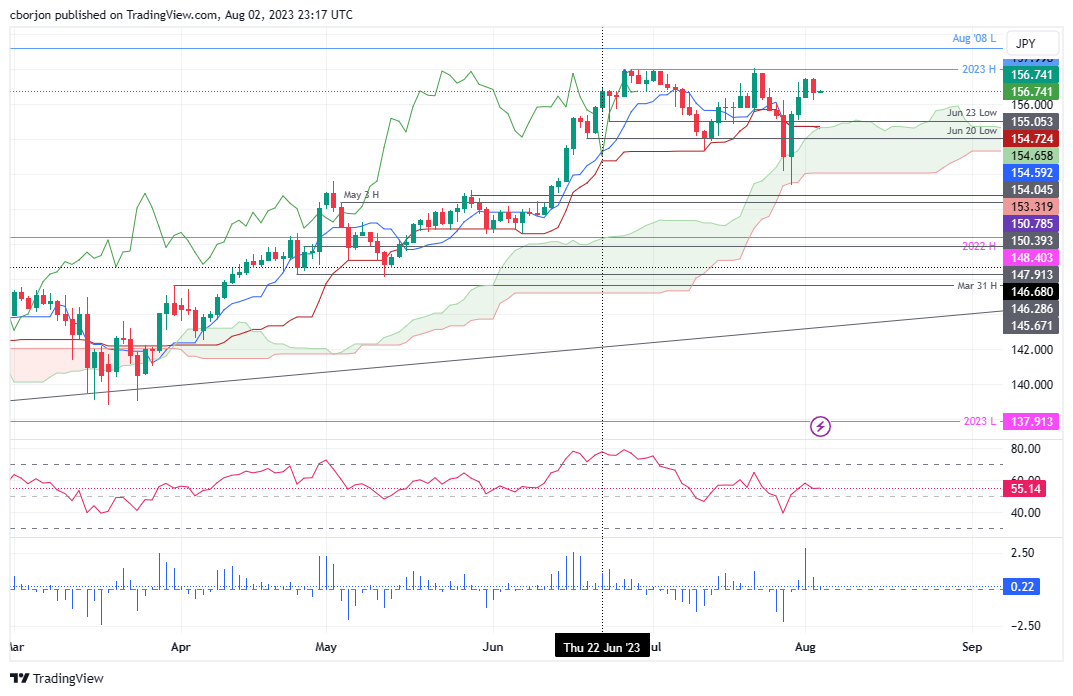
The EUR/JPY appears to have peaked at around the 156.80/157.40 area, as depicted in the daily chart. The cross-currency pair has failed to decisively clear the 158.00 mark, exacerbating its fall beneath the 157.00 figure. In addition, a two-day candlestick called dark cloud cover looms, but Thursday’s price action must clear Wednesday’s daily low of 156.25 and achieve a daily close below the latter to extend its losses.
Notably, the Tenkan-Sen sits below the Kijun-Sen, at around the top of the Ichimoku Cloud (Kumo) at around 154.59/72, a bearish signal. Furthermore, the Chikou Span is positioned below the price action, suggesting that sellers could regain control in the near term.
The EUR/JPY first support would be 156.25, followed by the figure at 156.00. A breach of the latter will expose the Kijun-Sen at 154.72, followed by the Tenkan-Sen at 154.59, before dipping inside the Kumo. Conversely, if EUR/JPY reclaims 157.00, that could open the door for further upside, with buyers challenging 158.00.