AUD/JPY Price Analysis: Prices tumble below the 1-hour Kumo; further downside expected

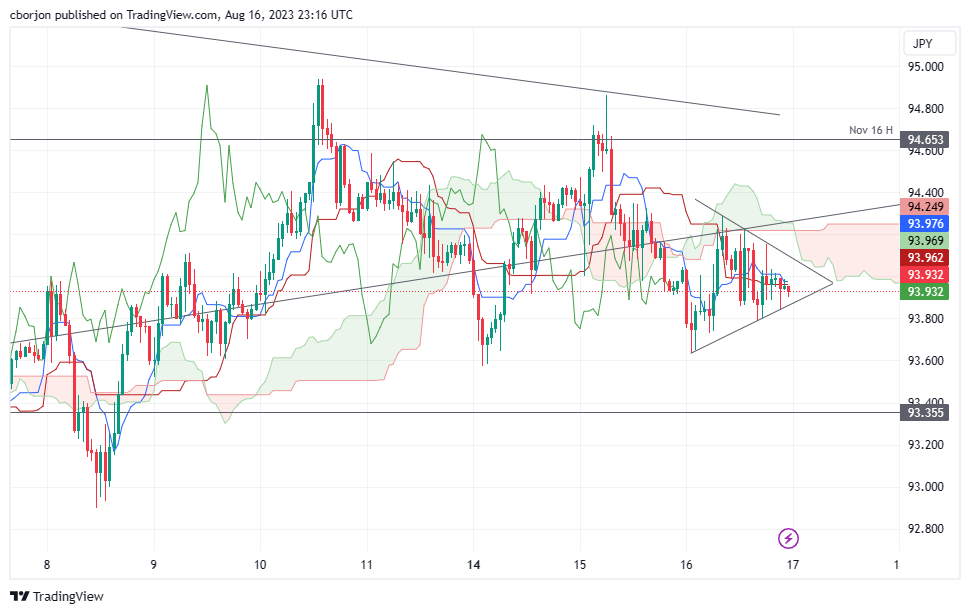
- AUD/JPY trades near the week’s lows, with a potential move toward the bottom of the Ichimoku Cloud (Kumo).
- Tenkan and Kijun-Sen lines set immediate resistance levels at 93.95 and 93.97, respectively.
- Descending triangle formation on the hourly chart suggests potential for further downside.
- AUD/JPY key support levels to watch: 93.79, 93.63, and 92.89.
AUD/JPY sits near the week’s lows and threatens to extend its losses toward the bottom of the Ichimoku Cloud (Kumo) as Thursday’s Asian session begins. At the time of writing, the AUD/JPY is exchanging hands at 93.97, registering minuscule losses of 0.03%.
AUD/JPY Price Analysis: Technical outlook
The AUD/JPY daily chart portrays the pair neutral-bearish, set to stay within the Kumo amid the lack of a catalyst that could trigger a downward break. The AUD/JPY remains in a downward mode after achieving successive series of lower highs and lower lows, seeing as a sign of a downtrend. Unless buyers reclaim the July 31 daily high of 95.82, the AUD/JPY pair could test the bottom of the Kumo at 93.40.
Short term, the AUD/JPY hourly chart portrays the pair as bearish biased, as price action lies below the Kumo. In addition, the Tenkan and Kijun-Sen lines lie above the spot price, acting as resistance levels, each at 93.95 and 93.97.
Nevertheless, from a pure price action point of view, the AUD/JPY is forming a descending triangle, which could pave the way for further losses. A breach of the bottom trendline will expose 93.79 as the first support, followed by the August 16 daily low of 93.63. Once those levels are cleared, the next support would emerge at an August 8 daily low of 92.89.
