GBP/USD Price Analysis: Portrays anxiety within symmetrical triangle above 1.2700 ahead of UK/US PMI

- GBP/USD remains on the sideline after reversing from two-week low.
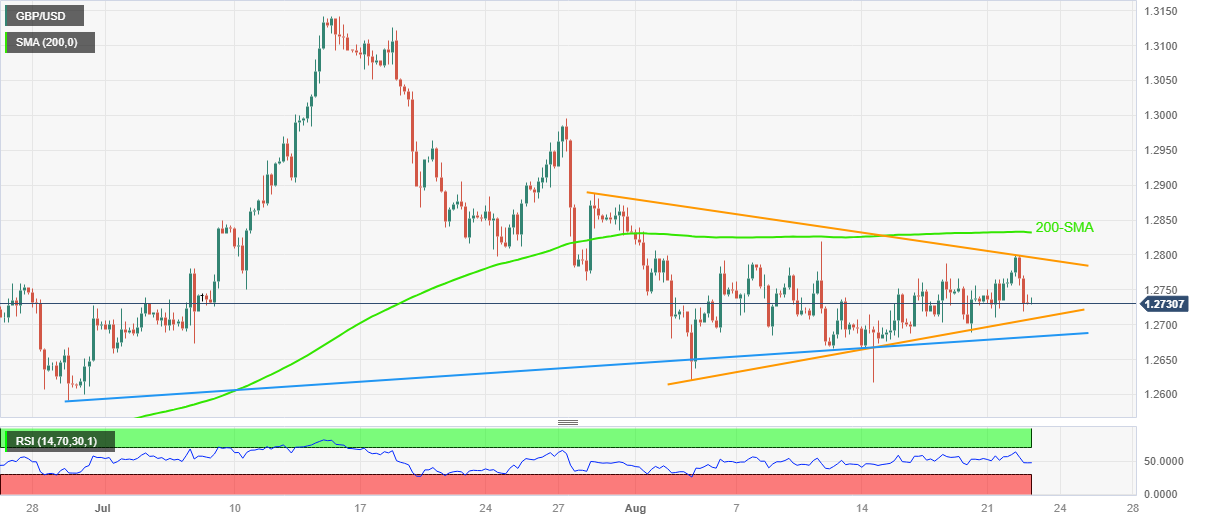
- Three-week-old symmetrical triangle restricts immediate moves between 1.2710 and 1.2800.
- Steady RSI, two-month-old rising support line also challenge Cable pair’s trading moves.
- Upbeat UK PMIs will need validation from softer US PMIs, downbeat Fed talks to keep Pound Sterling firmer.
GBP/USD edges lower past 1.2750 after reversing from the highest level in a fortnight the previous day, mostly quiet around 1.2750 amid the early hours of Wednesday’s Asian session. In doing so, the Cable pair portrays the market’s cautious mood ahead of the preliminary readings of the August month Purchasing Managers Indexes (PMIs) for the UK and the US.
That said, a three-week-old symmetrical triangle formation restricts immediate Pound Sterling moves between 1.2710 and 1.2800. It’s worth noting that the steady RSI (14) also portrays the market’s indecision.
Apart from the symmetrical triangle, an ascending support line from late June and the 200-SMA hurdle, respectively near 1.2680 and 1.2835, also act as additional trading filters for the GBP/USD pair.
It’s worth noting, however, that an upside break of the 200-SMA won’t hesitate to challenge the late July swing high of around 1.3000 whereas the Pound Sterling’s fall below 1.2680 will aim for the June 29 swing low of surrounding 1.2590.
Above all, the GBP/USD maintains the gradual downtrend from the mid-July peak despite the latest inaction. That said, a likely softer UK PMIs can keep the Cable bears even if the US activity data matches the unimpressive forecasts.
Also read: GBP/USD post losses amidst risk aversion, China’s economic woes
GBP/USD: Four-hour chart
Trend: Gradual downside expected
