
GBP/USD Price Analysis: Multiple hurdles, US data prod Cable buyers above 1.2700
- GBP/USD fades recovery from two-month low amid cautious mood.
- Lackluster oscillators, slew of technical resistances challenge Cable buyers.
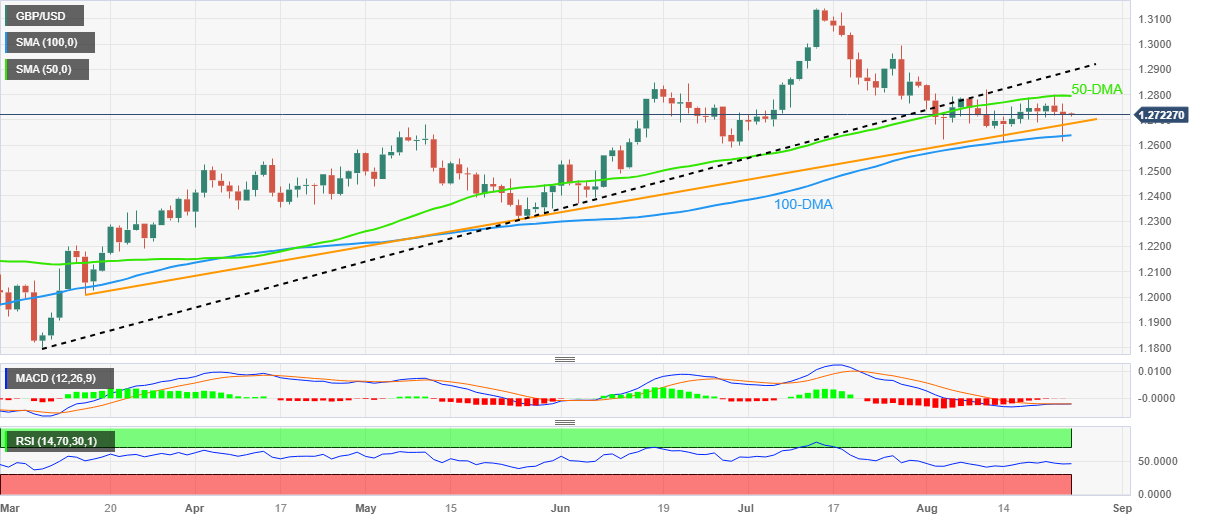
- Ascending trend line from mid-March, 100-DMA restrict immediate downside.
- 50-DMA, June’s peak and 5.5-month-long previous support line guard Pound Sterling recovery.
GBP/USD stays defensive around 1.2715-20 during the early hours of Thursday’s Asian session, fading the previous day’s rebound from the lowest level in eight weeks amid the market’s anxiety ahead of the top-tier data/events.
The Cable pair bounced off the 100-DMA and once again provided a daily close beyond an ascending support line from March 15, which in turn lures the Cable Sterling buyers as the US Dollar and Treasury bond yields drop. However, the cautious mood ahead of the top-tier US data and the start of the two-day-long annual Jackson Hole Symposium joins a slew of technical resistances to challenge the pair’s immediate upside.
That said, steady RSI (14) line and sluggish MACD signals also fail to inspire the GBP/USD buyers.
Among the key upside hurdles, the 50-DMA level of around 1.2800 and the support-turned-resistance line from early March, close to 1.2895 at the latest, appear major challenges for the Cable buyers. On the same line is June’s peak of around 1.2850.
It should be noted that a clear upside break of 1.2895 will need validation from the 1.2900 to convince the Pound Sterling buyers to aim for the 1.3000 threshold and the YTD peak of 1.3142.
On the flip side, the previously mentioned support line from March 15 and the 100-DMA, near 1.2685 and 1.2640 in that order, restrict the immediate downside of the GBP/USD pair. Additionally, May’s high of 1.2680 also acts as a downside filter.
Overall, GBP/USD remains on the bear’s radar unless it crosses the 1.2900 round figure.
GBP/USD: Daily chart
Trend: Pullback expected