US Dollar Index Price Analysis: DXY retreats towards 103.15-10 support confluence ahead of US PMI

- US Dollar Index takes offers to extend pullback from 10-week high.
- Overbought RSI, pre-data consolidation prod DXY bulls.
- Convergence of 200-DMA, previous resistance line from March puts a floor under the DXY price.
- Descending resistance line from March 15 guards US Dollar Index upside ahead of US PMI for August.
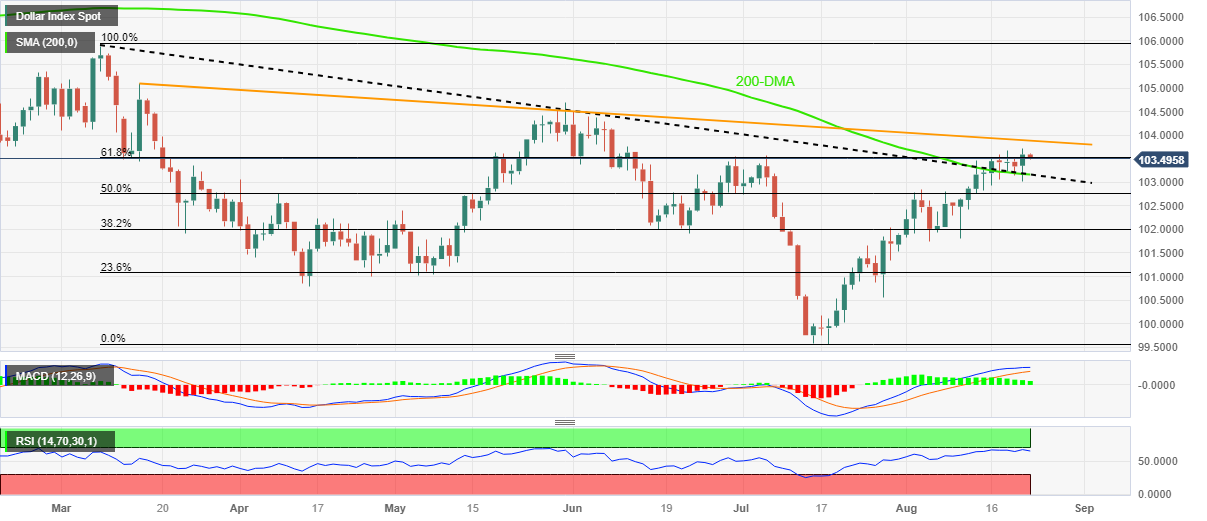
US Dollar Index (DXY) renews its intraday low near 103.50 as it reveres from the 2.5-month high marked the previous day during early Wednesday. In doing so, the Greenback’s gauge versus the six major currencies portrays the market’s consolidation ahead of the preliminary readings of the August month Purchasing Managers Indexes (PMIs) for the US.
That said, the overbought RSI (14) line also favors the DXY’s pullback from the multi-day high.
However, the bullish MACD signals join the convergence of the 200-DMA and resistance-turned-support line from early March to put a floor under the US Dollar Index around 103.15-10.
Should the DXY prices drop below the 103.10 support confluence, the 50% Fibonacci retracement of its March-July downside, near 102.75, will lure the Greenback sellers.
Meanwhile, the US Dollar Index rebound needs validation from a downward-sloping resistance line from March 15, close to 103.90, as well as the 104.00 round figure, to convince the DXY bulls.
Following that, the gauge’s upside towards May’s peak of 104.70 and then to the yearly peak of 105.88 can be expected.
US Dollar Index: Daily chart
Trend: Limited downside expected
