Silver Price Analysis: XAG/USD prints seven-day downtrend as $22.60 lures bears

- Silver Price remains depressed at the lowest level in two weeks.
- Clear downbeat break of 200-EMA, bearish MACD signals direct XAG/USD sellers toward six-month-old rising support line.
- Multiple hurdles stand tall to challenge Silver Price recovery even as RSI conditions suggest limited downside room.
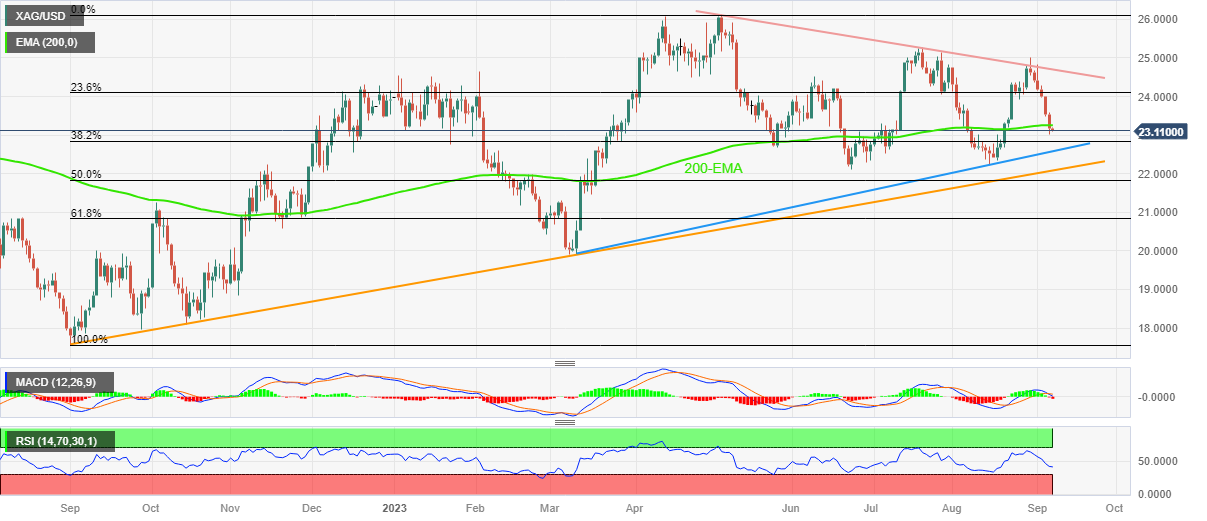
Silver Price (XAG/USD) dropped for the seventh consecutive day while fading the previous day’s corrective bounce off a two-week low by declining to $23.10 early Thursday morning. In doing so, the bright metal justifies the bearish MACD signals and a clear downside break of the 200-day Exponential Moving Average (EMA).
In addition to the technical signals, the market’s downbeat sentiment and the broadly firmer US Dollar also keep the XAG/USD sellers hopeful.
However, the RSI (14) line is below 50.0 and suggests bottom-picking of the commodity, which in turn highlights an ascending support line from early March, close to $22.60 as the key level to watch for the bears.
It’s worth noting that the precious metal’s failure to rebound from $22.60, will make it vulnerable to test a one-year-long rising trend line, close to $22.10, quickly followed by the $22.00 threshold.
In a case where the Silver Price remains bearish past $22.00, the odds of witnessing a gradual downside toward March’s low of around $19.90 can’t be ruled out. During the likely fall, the 50.0% and 61.8% Fibonacci ratios of September 2022 to May 2023 upside, respectively near $21.85 and $20.80, as well as the $20.00 psychological magnet, can test the XAG/USD sellers.
Alternatively, a daily closing beyond the 200-EMA level of $23.25 isn’t an open invitation to the Silver buyers as multiple levels around $24.00 and $24.20 may test the Silver Price recovery before highlighting the key resistance line stretched from May, close to $24.70 at the latest.
Silver Price: Daily chart
Trend: Limited downside expected
