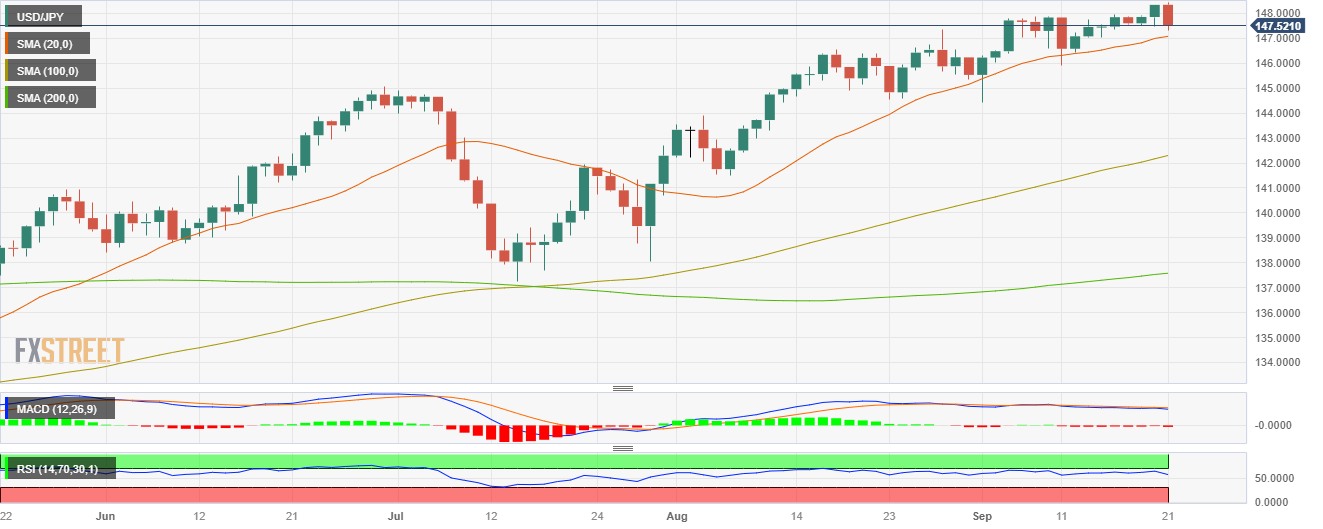
USD/JPY declines below 148.00 despite US strength, BoJ decision eyed

- The USD/JPY took a hit and declined near 147.50.
- The US reported mixed economic data. Treasury yields are soaring high.
- Investors await BoJ’s decision and Japanese inflation figures during the Asian session.
On Thursday, the USD/JPY faced downward pressure, declining near 147.50 and seeing 0.60% losses. Hopes of a Bank of Japan (BoJ) policy shift (or a signal) are keeping the JPY afloat despite the USD strengthening, driven by US Treasury yields rallying after the Federal Reserve (Fed) decision on Wednesday.
The JPY is up against most of its rivals but despite that the BoJ may still disappoint markets on Friday and maintain its dovish stance. Local wage and inflation trends are key drivers in the decision-making process around monetary policy shifts and until these figures rise above the bank’s forecast, they won’t consider leaving their current loose policy stance. Any additional clues the BoJ gives in its statement, however, will help investors model their expectations regarding the next meetings and could affect the Yen’s price dynamics.
The Federal Reserve (Fed) was more hawkish than expected at its September meeting, hinting at one more hike in 2023 than previously expected and two less rate cuts in 2024. The combination of higher expected interest rates for longer this has fueled has pushed the US Dollar up via higher Treasury yields, which stand at multi-year highs. The 2-year rate is 5.16%, while the 5 and 10-year yields soared to 4.60% and 4.47%, respectively.
Moreover, the US reported mixed data during the session, as Jobless Claims for the second week of September were lower than expected, while the Philadelphia’s Fed Manufacturing Survey declined to 13.5, missing by wide margin expectations. It’s worth mentioning that despite the Fed being hawkish in interest rate terms, Chair Powell noted that the next decisions will rely solely on incoming data, so the US price dynamics will see volatility on releasing high-tier economic figures. On Friday, markets await September S&P Global PMI figures.
USD/JPY Levels to watch
Despite the USD/JPY’s daily declines, the broader outlook on the daily chart is still bullish. The Relative Strength Index (RSI) is favourably positioned in positive territory above its midline but reflects a downward movement. The pair is above the 20,100,200-day Simple Moving Average (SMA), suggesting that the bulls are firmly in control of the bigger picture.
The Moving Average Convergence Divergence (MACD) is showing a bearish divergence with price which has continued to make higher highs whilst the MACD has not. The MACD line crossed below the signal line whilst in positive territory, on September 11, confirming a sell signal. Price did not respond, however, and continued rising. It’s possible the current weakness is a delayed bearish response to these indicators. It may also be the case that given the overall bullish trend, MACD and RSI are proving less reliable than usual at signalling bearish turns.
Support levels: 147.10 (20-day SMA), 146.00, 145.00
Resistance levels: 148.00, 149.00, 150.00.
