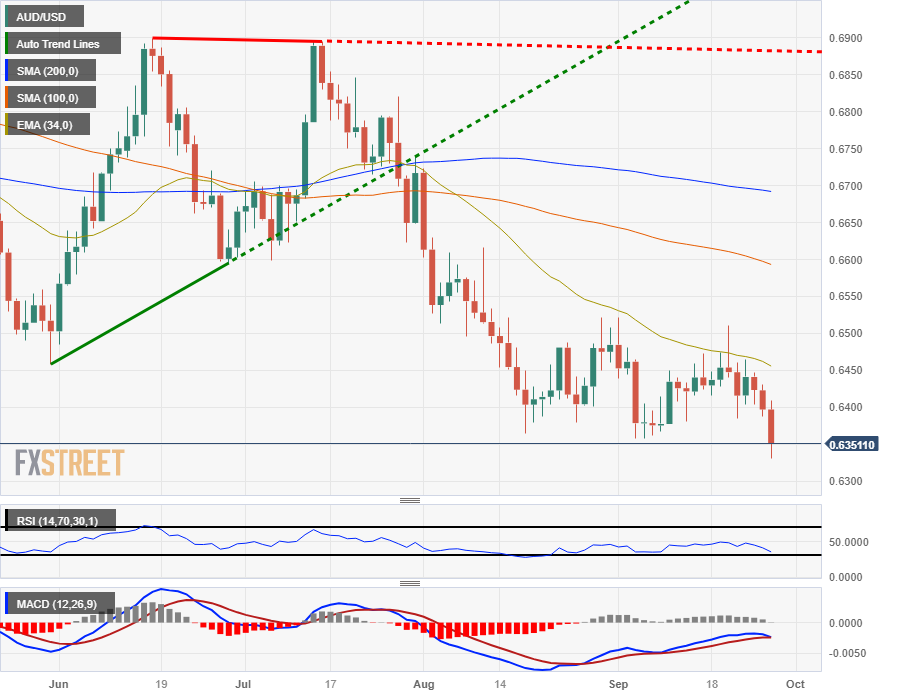
AUD/USD pings new ten-month lows into 0.6330 ahead of Aussie Retail Sales, US PCE

- The AUD/USD tests into new lows for the year, looking for a rebound from 0.6350.
- Upbeat US data is sending the Greenback higher, durable goods beat expectations.
- The latter half of the trading week still sees AU Retail Sales, US GDP, PCE.
The AUD/USD slipped to a ten-month low of 0.6331 in late Wednesday trading and is currently down around 45 pips, or -0.7%, for the day near 0.6350.
Australian Consumer Price Index (CPI) figures rose to 5.2% in August, in-line with market expectations and providing a minor boost for the Aussie (AUD) in the early Friday session, but bullish momentum for the AUD/USD proved short-lived as US data beats sent the Greenback (USD) higher once more.
Upcoming calendar: Aussie Retail Sales, US GDP & PCE
US Durable Goods Orders climbed to 0.2%, handily beating the forecast -0.5% and rebounding from the previous printing of -5.6%.
Coming up on Thursday is Australian Retail Sales early in the session at 01:30 GMT, and the headline monthly figure is anticipated to print at 0.3% for August, a minor tick lower than the previous period’s 0.5%.
US Gross Domestic Product (GDP) figures will land later on at 12:30 GMT, which is broadly forecast to hold steady at 2.1% for the second quarter.
The Greenback is seeing further support from climbing US Treasuries this week as broad-market jitters over an impending US government shutdown is sending borrowing costs higher.
Adding to bullish USD market momentum are hawkish comments from Federal Reserve (Fed) board members, with the President of the Minneapolis Federal Reserve Neel Kashkari hitting wires with comments leaving room for more rate hikes in the future, as well as the possibility of rates remaining at their current levels should rate cuts get pushed even further out.
AUD/USD technical outlook
As the Aussie slips to new yearly lows against the Greenback, the AUD/USD is dropping away from major moving averages, with the 200-day Simple Moving Average far overhead at 0.6700 while the 34-day Exponential Moving Average (EMA) provides technical resistance from overhead, just north of 0.6450.
Hourly candlesticks see the AUD/USD’s intraday price action accelerating to the downside from a bearish trendline from last week’s last swing high into 0.6460. The 200-hour SMA has also begun to turn bearish, dropping towards 0.6420 as short side candles accumulate on the averages.
