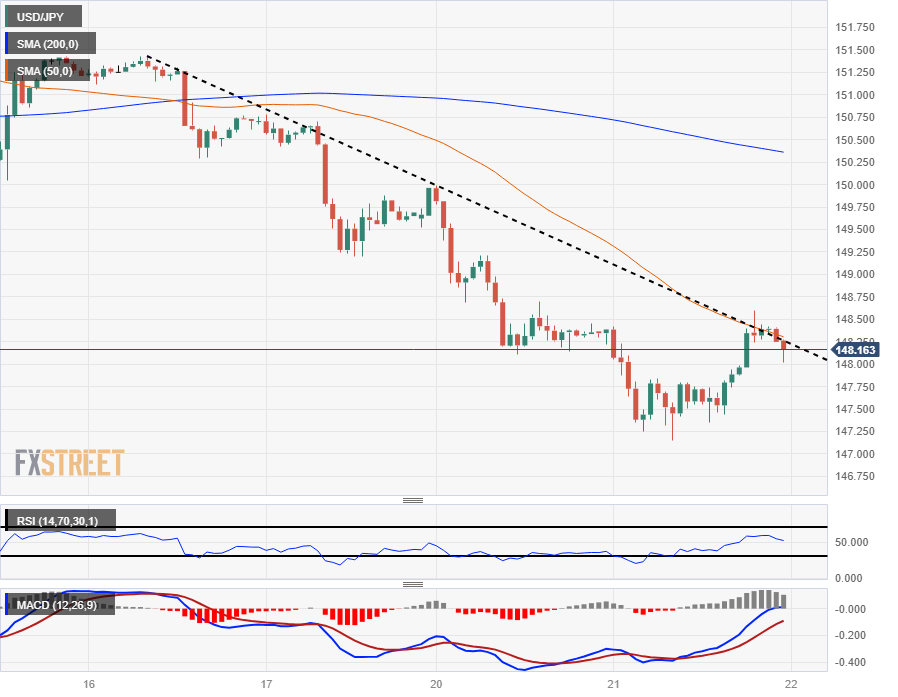
USD/JPY battling it out for the 148.00 handle heading into the Wednesday trading window

- The USD/JPY pair is struggling to hold onto limited gains from Tuesday’s trading session.
- The US Dollar slid to a ten-week low against the Yen as the pair slips back from long-term highs.
- US labor data due on Wednesday, Japan national inflation figures on Thursday.
The USD/JPY kicked off Tuesday with a quick drop from the 148.40 region into a new ten-week low near 147.15, but the US Dollar (USD) managed to recover its balance and reclaim the 148.00 handle, bolstered against the Japanese Yen (USD) by a softly hawkish Federal Reserve (Fed) Meeting Minutes release.
The Federal Reserve’s (Fed) latest minutes from the US central bank’s October 31st – November 1st meeting revealed that the Federal Open Market Committee (FOMC) remains firmly committed to higher rates to combat forward-looking inflation expectations.
Markets initially twisted on release, but remain steady heading into Wednesday’s trading despite the notable tonal disconnect between a hawkish Fed and broader markets’ desire for a rate cut cycle to begin.
US Initial Jobless Claims for the week ending November 17th are expected to retreat slightly to 225K from the previous week’s multi-year high of 231K; the 4-week average for Initial Jobless Claims is currently 220.25K.
The US Michigan Consumer Sentiment Index is expected to slightly improve for November from 60.4 to 60.5, and US Durable Goods Orders in October are forecast to show a decline from 4.6% to -3.1%. US Inflation Expectations are also forecast to hold steady at 3.2% in November.
Japanese Yen price this week
The table below shows the percentage change of Japanese Yen (JPY) against listed major currencies this week. Japanese Yen was the strongest against the US Dollar.
| USD | EUR | GBP | CAD | AUD | JPY | NZD | CHF | |
| USD | -0.10% | -0.72% | -0.15% | -0.68% | -1.22% | -0.94% | -0.30% | |
| EUR | 0.10% | -0.63% | -0.04% | -0.57% | -1.12% | -0.83% | -0.20% | |
| GBP | 0.72% | 0.63% | 0.58% | 0.05% | -0.48% | -0.20% | 0.43% | |
| CAD | 0.15% | 0.05% | -0.58% | -0.53% | -1.07% | -0.79% | -0.16% | |
| AUD | 0.67% | 0.58% | -0.04% | 0.53% | -0.54% | -0.25% | 0.38% | |
| JPY | 1.21% | 1.11% | 0.25% | 1.04% | 0.53% | 0.30% | 0.88% | |
| NZD | 0.94% | 0.83% | 0.21% | 0.79% | 0.25% | -0.28% | 0.63% | |
| CHF | 0.30% | 0.20% | -0.42% | 0.15% | -0.39% | -0.92% | -0.63% |
The heat map shows percentage changes of major currencies against each other. The base currency is picked from the left column, while the quote currency is picked from the top row. For example, if you pick the Euro from the left column and move along the horizontal line to the Japanese Yen, the percentage change displayed in the box will represent EUR (base)/JPY (quote).
USD/JPY Technical Outlook
The USD/JPY has seen steady declines from last week’s highs near 151.91, closing bearish for four of the last five trading sessions, and is set to close for a fourth straight red candle if Tuesday closes below 148.33.
This week’s decline sees the pair trading to the south side of the 50-day Simple Moving Average (SMA) near 149.50, and long-term technical support will be waiting to meet bears at the 200-day SMA near 141.50.
USD/JPY Hourly Chart
USD/JPY Daily Chart

