
Dow Jones Industrial Average News: DJIA adds 0.5% on Wednesday
- Dow Jones Industrial Index rose 1.94% last week and has advanced slightly this week as well.
- US Initial Jobless Claims came in well below expectations.
- Durable Goods Orders dropped 5.4% MoM, well below consensus.
- Preliminary Manufacturing and Services PMIs arrive on Friday during a shortened trading session.
The Dow Jones Industrial Average (DJIA) is advancing on Wednesday as the market experiences low trading volume ahead of Thursday’s Thanksgiving holiday and Friday’s shortened session. The DJIA index has run up 0.5% at the time of writing, neck-and-neck with the S&P 500 but below the NASDAQ Composite’s 0.7% advance.
The DJIA rose 1.94% last week, its third week of gains, and has also been gathering steam this week. Nvidia (NVDA) earnings late Tuesday amounted to an impressive beat, but the premier semiconductor stock opened 2% lower on Wednesday.
Lower Initial Jobless Claims are demonstrating that the US labor market is not collapsing as some estimated last week, but Durable Goods Orders fell much further than the market expected.
Dow Jones News: Hawkish FOMC Minutes fail to dissuade bulls
Nvidia earnings may not have meant much for Nvidia itself, as expectations were so high, but the market seems to be benefiting from them. All three major Wall Street indices opened higher on Wednesday. CEO Jensen Huang’s company raised its outlook by more than $2 billion for fourth-quarter revenue, an event that seems unlikely if a recession were on the horizon.
Tuesday’s hawkish FOMC Minutes have also failed to alter the market’s bullish foundation. The CME Group FedWatch Tool has placed the odds of an interest rate cut at 62% for the Federal Reserve’s May meeting. The March meeting continues to see odds of a cut near 29%.
The Fed left the door open for more hikes, but the market is not in agreement. The soft landing thesis is still leading the narrative. Initial Jobless Claims for the week ending November 18 arrived at 209K – well below the consensus of 225K. It was still a positive reading as it was a 24K decrease from the previous week’s 233K reading (revised 2K higher). Placid, ho-hum Initial Jobless Claims are what the market wants, however, as it reads as a labor market sustaining its health but low enough not to trigger Fed hawks.
Durable Goods Orders for October fell 5.4% rather than the 3.1% drop that was expected. This could be a seasonal decline, but a large drop below consensus for November could worry the market.
The Michigan Consumer Sentiment Index for November arrived this morning at 61.3, above the consensus for 60.5 and the previous month’s 60.4 print.
S&P 500 FAQs
The S&P 500 is a widely followed stock price index which measures the performance of 500 publicly owned companies, and is seen as a broad measure of the US stock market. Each company’s influence on the computation of the index is weighted based on market capitalization. This is calculated by multiplying the number of publicly traded shares of the company by the share price. The S&P 500 index has achieved impressive returns – $1.00 invested in 1970 would have yielded a return of almost $192.00 in 2022. The average annual return since its inception in 1957 has been 11.9%.
Companies are selected by committee, unlike some other indexes where they are included based on set rules. Still, they must meet certain eligibility criteria, the most important of which is market capitalization, which must be greater than or equal to $12.7 billion. Other criteria include liquidity, domicile, public float, sector, financial viability, length of time publicly traded, and representation of the industries in the economy of the United States. The nine largest companies in the index account for 27.8% of the market capitalization of the index.
There are a number of ways to trade the S&P 500. Most retail brokers and spread betting platforms allow traders to use Contracts for Difference (CFD) to place bets on the direction of the price. In addition, that can buy into Index, Mutual and Exchange Traded Funds (ETF) that track the price of the S&P 500. The most liquid of the ETFs is State Street Corporation’s SPY. The Chicago Mercantile Exchange (CME) offers futures contracts in the index and the Chicago Board of Options (CMOE) offers options as well as ETFs, inverse ETFs and leveraged ETFs.
Many different factors drive the S&P 500 but mainly it is the aggregate performance of the component companies revealed in their quarterly and annual company earnings reports. US and global macroeconomic data also contributes as it impacts on investor sentiment, which if positive drives gains. The level of interest rates, set by the Federal Reserve (Fed), also influences the S&P 500 as it affects the cost of credit, on which many corporations are heavily reliant. Therefore, inflation can be a major driver as well as other metrics which impact the Fed decisions.
Dow Jones Industrial Average forecast: Overbought after November rally
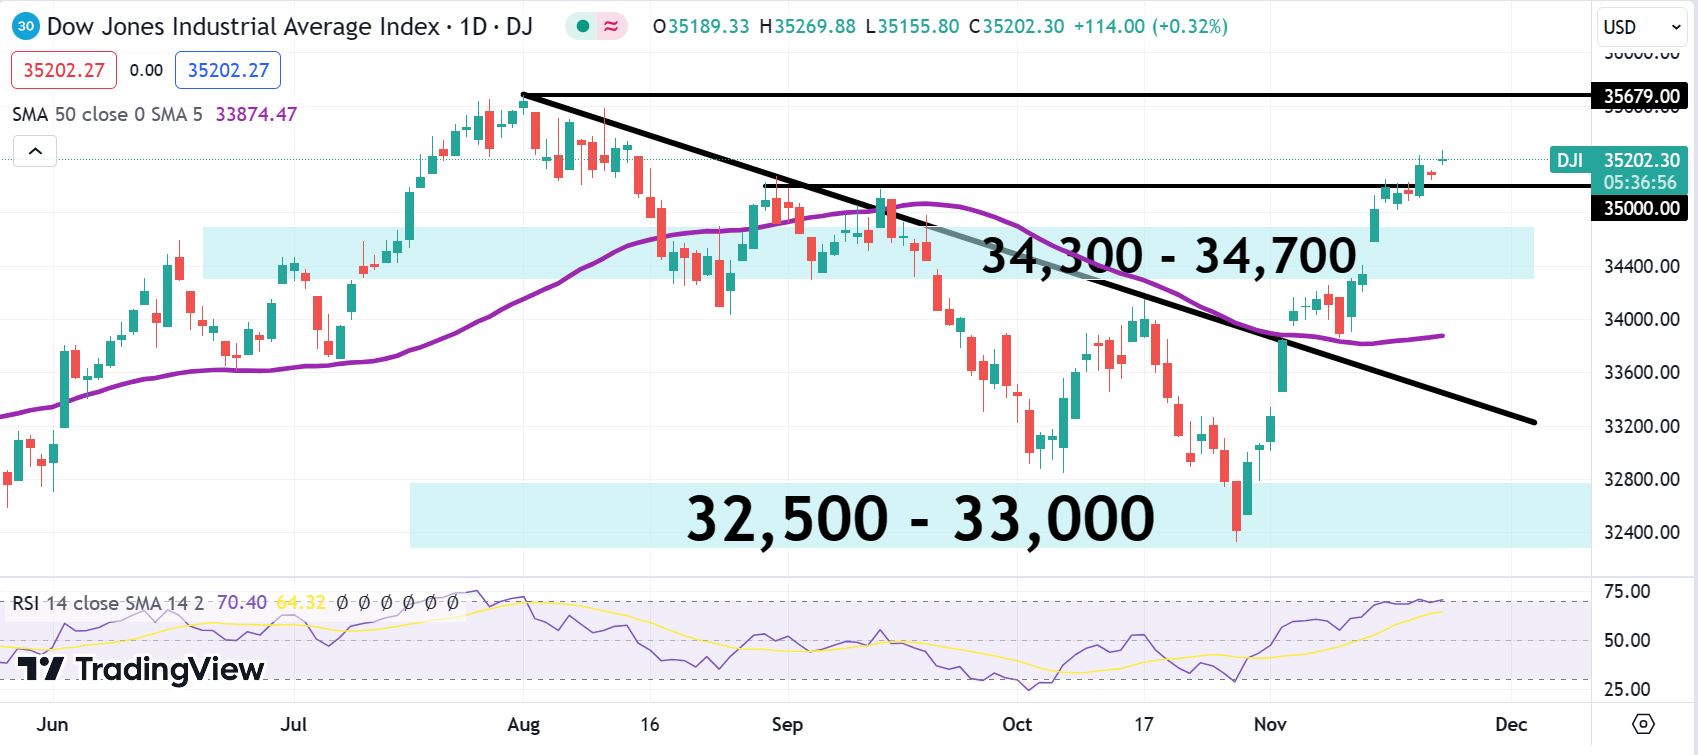
The Dow Jones index has risen above the late August highs over the past week and is now gunning to take out the August 1 high sometime in December. That 35,679 high was the highest the index has reached in about 18 months, and a close above that level signifies that the index is back in bullish territory.
In the near term, investors will note that the Relative Strength Index (RSI) has reached overbought levels. Typically, this means that a pullback is in order. If the 35,000 resistance level turns into support, then the 34,300 to 34,700 demand zone could do the trick. Otherwise, the 50-day Simple Moving average (SMA) is hovering just below the early November consolidation just below 33,900.
Dow Jones Industrial Average daily chart