
Canadian Dollar firmly in the green on Thursday despite mixed Canadian GDP print
- The Canadian Dollar is seeing a broad-market push higher.
- Canadian GDP mixed, but the underlying revisions are helping to bolster the CAD.
- OPEC supply cuts to prop up Crude Oil markets, underpin Loonie trading.
The Canadian Dollar (CAD) is catching a batch of bids during Thursday’s US trading session, bolstered by climbing Crude Oil. The Canadian Dollar is one of the best-performing of the major currency bloc, in the green against most of its major currency peers as the Loonie heads into the last quarter of the Thursday trading day.
Canadian Gross Domestic Product (GDP) came in mixed but leaning positive in the near-term data, and Crude Oil is lending the fossil-fueled Loonie some support. The Organization of the Petroleum Exporting Countries (OPEC) unanimously agreed to additional production cuts with an ambiguous end date.
Daily Digest Market Movers: Canadian Dollar makes a late topside break
- The Canadian Dollar caught a late surge on Thursday to outperform most of the major currency bloc.
- The CAD is up six-tenths of a percent against the Japanese Yen (JPY) and the Euro (EUR), and around half of a percent on the Pound Sterling (GBP) at the time of writing.
- Canadian GDP came in mixed, with the September MoM printing 0.1% above the expected flat 0.0%, while the YoY figure contracted steeply.
- Annualized third quarter Canadian GDP came in at -1.1%, sharply missing the market median forecast of 0.2% YoY growth, but the previous period’s figure did see a sharp upward revision, getting adjusted from -0.2% to 1.4%.
- Crude Oil markets are set for an upside twist after OPEC unanimously agreed (for the time being) to further cut oil output by an additional million barrels per day (bpd).
- Crude Oil price gains on the back of additional supply cuts likely to remain capped with plenty of spare capacity in global energy demand.
- OPEC is reporting that the additional production caps will last through Q1 2024.
Canadian Dollar price today
The table below shows the percentage change of Canadian Dollar (CAD) against listed major currencies today. Canadian Dollar was the strongest against the Euro.
| USD | EUR | GBP | CAD | AUD | JPY | NZD | CHF | |
| USD | 0.62% | 0.47% | -0.01% | 0.06% | 0.57% | -0.14% | -0.08% | |
| EUR | -0.62% | -0.13% | -0.65% | -0.55% | -0.02% | -0.76% | -0.70% | |
| GBP | -0.47% | 0.14% | -0.50% | -0.40% | 0.11% | -0.61% | -0.55% | |
| CAD | 0.01% | 0.64% | 0.50% | 0.10% | 0.61% | -0.11% | -0.06% | |
| AUD | -0.09% | 0.55% | 0.40% | -0.09% | 0.51% | -0.21% | -0.15% | |
| JPY | -0.59% | 0.04% | -0.11% | -0.60% | -0.53% | -0.69% | -0.65% | |
| NZD | 0.14% | 0.75% | 0.61% | 0.11% | 0.21% | 0.70% | 0.06% | |
| CHF | 0.09% | 0.70% | 0.53% | 0.06% | 0.13% | 0.64% | -0.07% |
The heat map shows percentage changes of major currencies against each other. The base currency is picked from the left column, while the quote currency is picked from the top row. For example, if you pick the Euro from the left column and move along the horizontal line to the Japanese Yen, the percentage change displayed in the box will represent EUR (base)/JPY (quote).
Technical Analysis: Canadian Dollar lurches higher on the day, sends the USD/CAD back below 1.3600
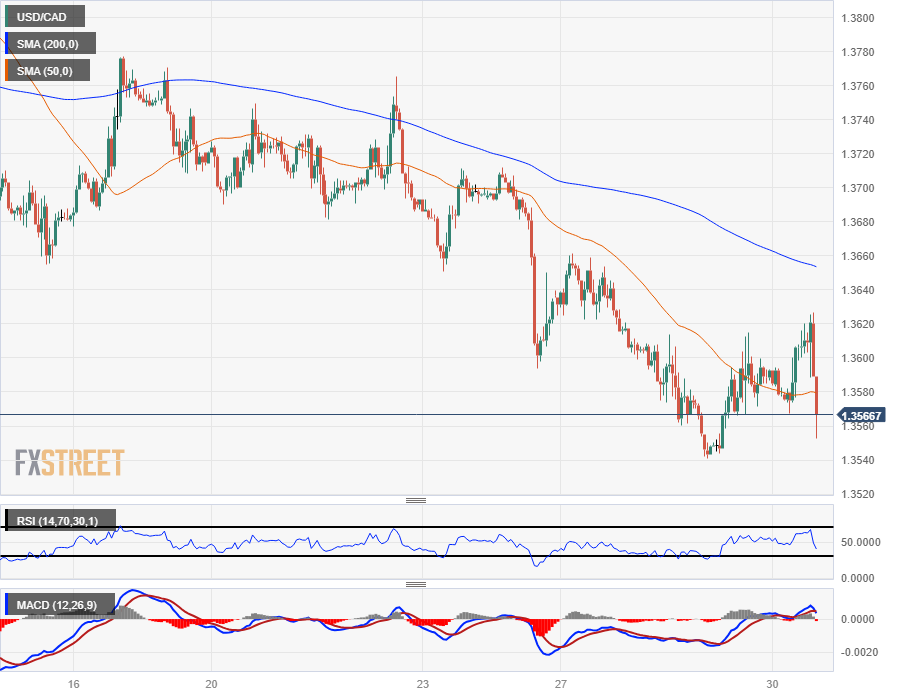
The Canadian Dollar (CAD) initially fell back against the US Dollar (USD) in Thursday trading with the pair reaching a three-day high of 1.3626, but the CAD’s late break sent the pair back below the 1.3600 handle to test the waters near 1.3550.
Intraday chart action continues to be capped by the 200-hour Simple Moving Average (SMA) descending into 1.3650 while the 50-day SMA is drawing prices into the near-term midrange around 1.3580.
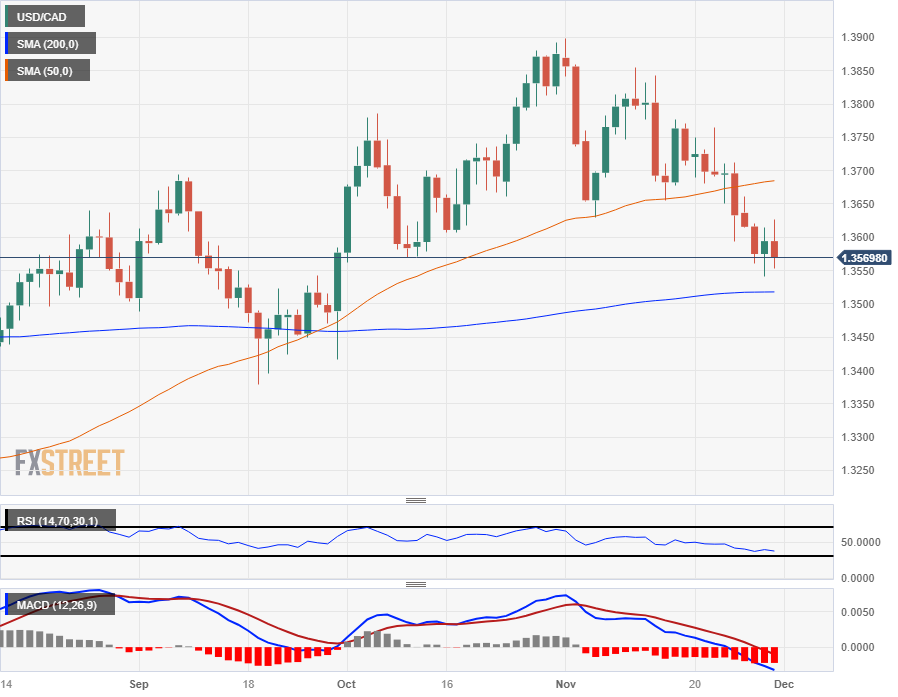
Daily candlesticks have the USD/CAD pair struggling to make downside progress towards the 200-day SMA just above 1.3500, and the CAD is struggling to carve out further downside territory against the USD despite Thursday’s Loonie push.
USD/CAD Hourly Chart
USD/CAD Daily Chart
GDP FAQs
A country’s Gross Domestic Product (GDP) measures the rate of growth of its economy over a given period of time, usually a quarter. The most reliable figures are those that compare GDP to the previous quarter e.g Q2 of 2023 vs Q1 of 2023, or to the same period in the previous year, e.g Q2 of 2023 vs Q2 of 2022.
Annualized quarterly GDP figures extrapolate the growth rate of the quarter as if it were constant for the rest of the year. These can be misleading, however, if temporary shocks impact growth in one quarter but are unlikely to last all year – such as happened in the first quarter of 2020 at the outbreak of the covid pandemic, when growth plummeted.
A higher GDP result is generally positive for a nation’s currency as it reflects a growing economy, which is more likely to produce goods and services that can be exported, as well as attracting higher foreign investment. By the same token, when GDP falls it is usually negative for the currency.
When an economy grows people tend to spend more, which leads to inflation. The country’s central bank then has to put up interest rates to combat the inflation with the side effect of attracting more capital inflows from global investors, thus helping the local currency appreciate.
When an economy grows and GDP is rising, people tend to spend more which leads to inflation. The country’s central bank then has to put up interest rates to combat the inflation. Higher interest rates are negative for Gold because they increase the opportunity-cost of holding Gold versus placing the money in a cash deposit account. Therefore, a higher GDP growth rate is usually a bearish factor for Gold price.