
S&P 500 News: Index holds onto losses into Monday’s close
- Standard & Poor’s 500 index has gained for five consecutive weeks.
- US Treasury yields rise more than 1% along much of the curve.
- Friday’s Nonfarm Payrolls report is the primary data release this week.
- Uber Technologies is set to join the index on December 18.
- Earnings arrive from Autozone, Nio, GameStop, Broadcom, Lululemon and Dollar General.
The S&P 500 index opened lower on Monday following five straight weeks of gains. The index is down 0.6% at the time of writing, while the NASDAQ Composite has lost more than 0.9% and the Dow Jones has receded 0.1%.
The index sits just shy of the yearly high at 4,607, and while gains have become lighter in the last two weeks, it still seems possible that the S&P 500 will mark a new annual high before the year is out.
US Treasury yields rose on Monday, a fact that has led equities to slide at the start of the week. The 12-month through 10-year all saw yields jump more than 1% on Monday.
Uber Technologies (UBER) has received notice that it will join the S&P 500 on December 18, and shares of the rideshare company have spiked. Apple (AAPL) is placing a put on the index as it momentarily shutters production in India of its iPhone due to torrential rains.
Most of the market is focused on US jobs figures this week as the November Nonfarm Payrolls data gets released this Friday. Additionally, earnings from Broadcom, Lululemon and Autozone will catch eager ears throughout the week. This is in addition to GameStop (GME) , Nio (NIO) and Dollar General (DG).
S&P 500 News: Uber to join index
UBER stock gained more than 5% at the beginning of Monday, rising above $60 for the first time since April 2021. The rideshare or mobility company has managed to leave behind years of losses as CEO Dara Khosrowshahi has placed it on a trajectory of rising profitability. That newfound profitability has allowed it to finally be accepted into the S&P 500.
Uber stock will gain in price ahead of the index inclusion since index managers are forced to buy shares in the leadup to its official debut on December 18 – just two weeks from now.
Analysts have also had a lot of positive commentary for the stock. Oppenheimer raised its price target to $75 on UBER stock as S&P 500 inclusion marks a new era for the company. Argus raised its price target to $69. Both analysts expect UBER to enter the buyback game with its newfound focus on profitability.
“Following the inclusion, we expect UBER to lean into growth and share buybacks, which should increase investor sentiment for growth/ return in 2024,” wrote Oppenheimer analyst Jason Helfstein.
Argus estimated that Uber will earn $1.54 per share in 2024 on $47.1 billion in revenue.
Earnings collide with Nonfarm Payrolls for a busy first week of December
Before November’s much-watched jobs report comes on Friday, several big-name firms will report earnings on the back end of a winding down earnings season.
Broadcom (AVGO) is arguably the most important of these companies. The stock is up more than 67% year to date and has recently received its final go-ahead from important global regulators in order to finalize its acquisition of VMWare.
After the market closes on Thursday, Broadcom is expected to deliver adjusted EPS of $10.96 on revenue of $9.28 billion.
Lululemon (LULU) will compete with Broadcom for eyeballs late Thursday. It is slated to report consensus adjusted EPS of $2.28 on $2.19 billion in sales. The activewear brand nearly always beats the consensus, but the stock has received two earnings revisions in the past few months for the reporting quarter.
Autozone (AZO) on Monday is expected to earn $31.57 in adjusted EPS on $4.19 billion in sales. Both of these figures demonstrate healthy growth over the same quarter a year ago, but analysts are mixed based on earnings revisions for the quarter.
Then on Friday, investors will turn their gaze toward the November Nonfarm Payrolls report. A number under 200K will delight the market as labor market weakness is thought necessary to appease the Federal Reserve. Investors have started to take bets on a central bank rate cut at either the March or May meetings. At the moment, the May meeting is the favorite by a long shot.
Consensus calls for 180K net new hires on Friday, which comes after October’s 150K number. A figure too far below 150K might worry the market that a hard landing has finally begun. The Unemployment Rate is expected to stand still at 3.9%.
S&P 500 FAQs
The S&P 500 is a widely followed stock price index which measures the performance of 500 publicly owned companies, and is seen as a broad measure of the US stock market. Each company’s influence on the computation of the index is weighted based on market capitalization. This is calculated by multiplying the number of publicly traded shares of the company by the share price. The S&P 500 index has achieved impressive returns – $1.00 invested in 1970 would have yielded a return of almost $192.00 in 2022. The average annual return since its inception in 1957 has been 11.9%.
Companies are selected by committee, unlike some other indexes where they are included based on set rules. Still, they must meet certain eligibility criteria, the most important of which is market capitalization, which must be greater than or equal to $12.7 billion. Other criteria include liquidity, domicile, public float, sector, financial viability, length of time publicly traded, and representation of the industries in the economy of the United States. The nine largest companies in the index account for 27.8% of the market capitalization of the index.
There are a number of ways to trade the S&P 500. Most retail brokers and spread betting platforms allow traders to use Contracts for Difference (CFD) to place bets on the direction of the price. In addition, that can buy into Index, Mutual and Exchange Traded Funds (ETF) that track the price of the S&P 500. The most liquid of the ETFs is State Street Corporation’s SPY. The Chicago Mercantile Exchange (CME) offers futures contracts in the index and the Chicago Board of Options (CMOE) offers options as well as ETFs, inverse ETFs and leveraged ETFs.
Many different factors drive the S&P 500 but mainly it is the aggregate performance of the component companies revealed in their quarterly and annual company earnings reports. US and global macroeconomic data also contributes as it impacts on investor sentiment, which if positive drives gains. The level of interest rates, set by the Federal Reserve (Fed), also influences the S&P 500 as it affects the cost of credit, on which many corporations are heavily reliant. Therefore, inflation can be a major driver as well as other metrics which impact the Fed decisions.
Earnings of the week
Monday, December 4 – GitLab (GTLB)
Earnings spotlight: Tuesday, December 5 – AutoZone (AZO), Toll Brothers (TOL), MongoDB (MDB), NIO (NIO), JM Smucker (SJM)
Wednesday, December 6 – Brown-Forman (BF.A), Campbell Soup (CPB), C3.ai (AI), Chewy (CHWY), GameStop (GME), ChargePoint Holdings (CHPT)
Thursday, December 7 – Broadcom (AVGO), Lululemon (LULU), Dollar General (DG), DocuSign (DOCU)
What they said about the market – Michael Hartnett
Michael Hartnett, a strategist at Bank of America Securities, holds to the firm’s belief that the S&P 500 index will end next year at 5,000 – a new all-time high. Hartnett believes that the market is at an emotionally bullish inflection point and will rally into Valentine’s Day. Second, US presidential election years are normally good for the stock market.
“Our parachute in 2024 is the politics: elections means stimulus, and that means the landing will be soft not hard.”
S&P 500 forecast
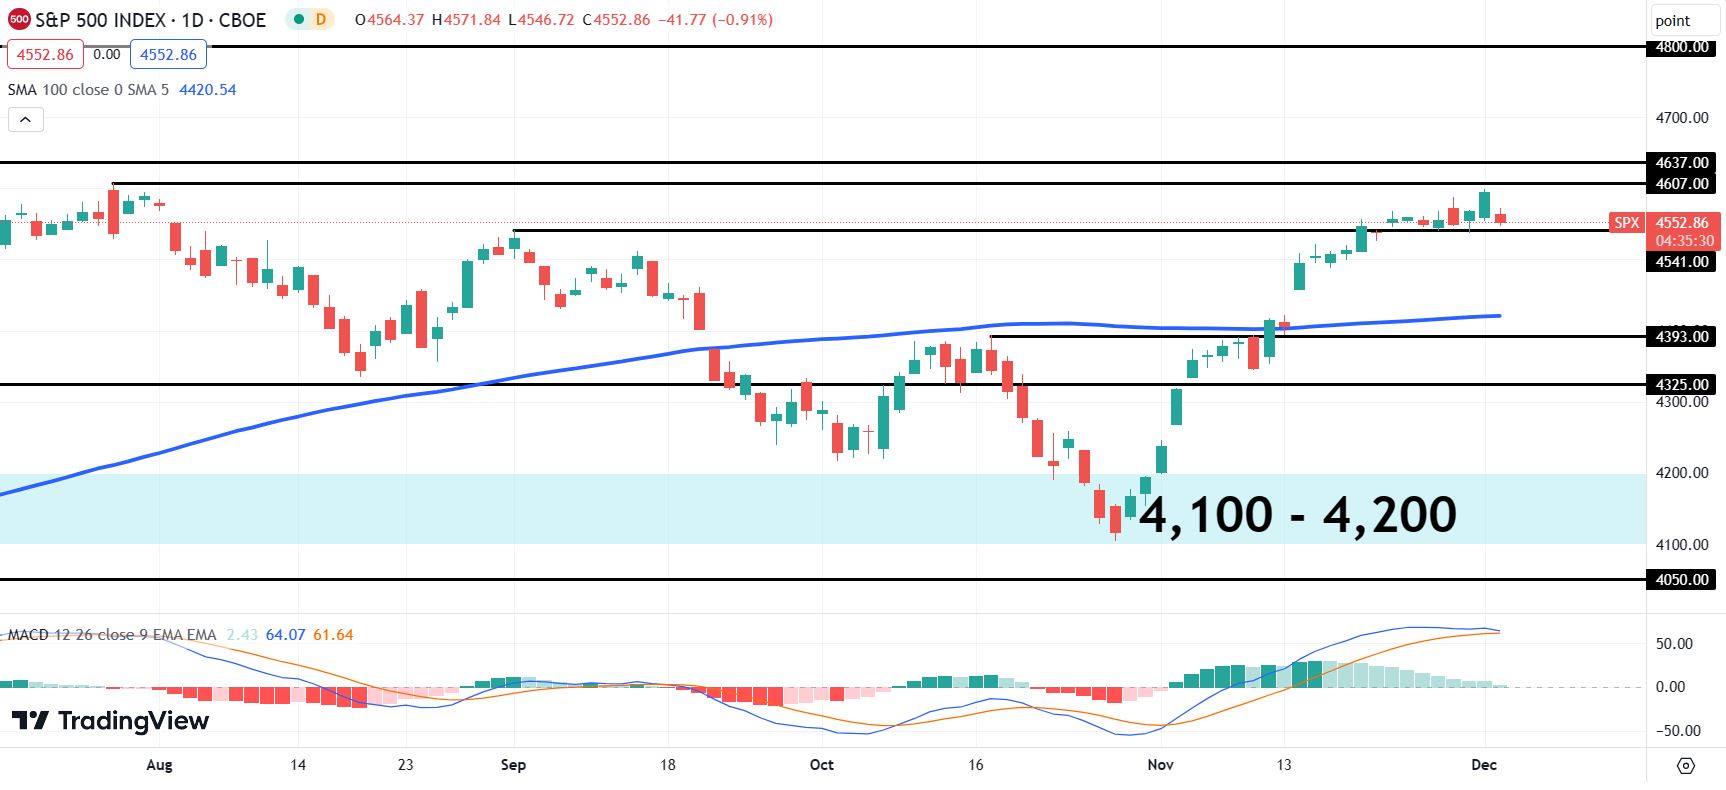
In November the S&P 500 blew right through the 4,541 resistance point stemming from the lower high on September 1. However, there are two other historical resistance levels in close succession. These are the July 27 annual high at 4,607 and then the 4,607 level from March 2022. Both of these resistance levels must be overcome in order to reach the 4,800 all-time high from December 2021.
The Moving Average Convergence Divergence (MACD) indicator, however, looks ready for a bearish crossover. Five weeks of gains need to be broken at some point, and this looks like the week to do it. The Relative Strength Index (RSI) – not shown in the graph below – has broken lower to a reading of 66 on Monday after several weeks of drifting within overbought territory.
A shakeout here could send the index back to the 4,541 level or even the 100-day Simple Moving Average (SMA), which currently sits at 4,420.
S&P 500 daily chart