
S&P 500 News: Index hits 2023 high at 4,620
- Standard & Poor’s 500 reaches new 2023 high at 4,620.
- US Treasury yields mixed following auction.
- US November CPI on Tuesday is projected to show inflation flattening out.
- Fed unveils interest rate decision on Wednesday, widely expected to keep rates unchanged.
- Oracle, Adobe, Costco, Darden Restaurants report earnings this week.
The S&P 500 index launched itself to a new high for the year on Monday. The index reached 4,620, which was just above the earlier annual high of 4,607 from July 27.
The S&P 500 index has gained 0.3% on Monday, in line with the Dow Jones and about double the NASDAQ Composite’s performance.
Longer-dated US Treasury yields rose about 1% on Monday, but later in the session the yield picture became mixed. The US Treasury auctioned off 3-month and 6-month bills and 3-year and 10-year bonds.
Investors will largely focus on November CPI data and how the Federal Reserve (Fed) on Wednesday discusses it. No one expects a change in rates at the Wednesday meeting, but there is uncertainty about the Fed’s Dot Plot heading into 2024.
S&P 500 News: November CPI forecast has inflation largely stable
Besides rising Treasury yields, another obstacle holding down stock market gains is the general consensus on Wall Street that November US CPI, out on Tuesday, will remain largely flat with the previous reading.
For instance, monthly headline inflation is expected to tick higher from 0% to 0.1%, while the annual reading is projected to decline from 3.2% to 3.1%.
Core inflation is in much the same boat. The monthly Core reading for November is expected to rise from 0.2% to 0.3%, while annually Core inflation is expected to remain flat at 4%.
This is not great news for investors since the Fed’s target is 2% annual Core inflation. Despite approximately 18 months of inflation declining, the central bank needs Core CPI to be cut in half to reach its goal. Investors have largely been sanguine about the issue so far, noting that inflation is overall moving in the right direction. But the central bank seems to confer more significance to boldly meeting its goal.
Like usual, a lower reading will help investors reap the harvest as stock prices will shoot higher. A higher CPI reading, on the other hand, will lead to a sell-off. This is because it will lead to forecasts for interest rates remaining higher for a longer period of time.
Wednesday FOMC meeting hinges on Dot Plot
Every quarter, the central bank releases an updated Dot Plot, wherein Fed governors predict future Fed interest rate decisions over the following couple of years. The release is relevant in that it helps stock pickers determine how tight or loose monetary policy will be well into the future.
The Dot Plot graph is found inside the Summary of Economic Projections (SEP) report that hasn’t been released since September. The September SEP startled Fed watchers by reducing the 2024 interest rates cuts from 1 percentage point to just fifty basis points.
The reason that the Dot Plot and SEP are more important on Wednesday is that the market is near unanimous in its outlook that the Fed will keep the fed funds rate at its current range of 5.25% to 5.5%. In the September SEP, the consensus called for one more rate hike before 2023 ended, but with inflation declining since then, most economists think this unlikely.
If the Dot Plot shows that the same 50 basis points is all the cuts that 2024 is likely to see, expect the S&P 500 to sell off. But a move back to 75 basis points or 100 being lopped off the fed funds rate one year from now will see the optimism spread like a PG&E-caused wildfire.
In addition to the Federal Open Market Committee (FOMC) meeting, Wednesday will deliver an updated Producer Price Index, this time for November. Core PPI is expected to decline from 2.4% annually to 2.3%.
Dow Jones FAQs
The Dow Jones Industrial Average, one of the oldest stock market indices in the world, is compiled of the 30 most traded stocks in the US. The index is price-weighted rather than weighted by capitalization. It is calculated by summing the prices of the constituent stocks and dividing them by a factor, currently 0.152. The index was founded by Charles Dow, who also founded the Wall Street Journal. In later years it has been criticized for not being broadly representative enough because it only tracks 30 conglomerates, unlike broader indices such as the S&P 500.
Many different factors drive the Dow Jones Industrial Average (DJIA). The aggregate performance of the component companies revealed in quarterly company earnings reports is the main one. US and global macroeconomic data also contributes as it impacts on investor sentiment. The level of interest rates, set by the Federal Reserve (Fed), also influences the DJIA as it affects the cost of credit, on which many corporations are heavily reliant. Therefore, inflation can be a major driver as well as other metrics which impact the Fed decisions.
Dow Theory is a method for identifying the primary trend of the stock market developed by Charles Dow. A key step is to compare the direction of the Dow Jones Industrial Average (DJIA) and the Dow Jones Transportation Average (DJTA) and only follow trends where both are moving in the same direction. Volume is a confirmatory criteria. The theory uses elements of peak and trough analysis. Dow’s theory posits three trend phases: accumulation, when smart money starts buying or selling; public participation, when the wider public joins in; and distribution, when the smart money exits.
There are a number of ways to trade the DJIA. One is to use ETFs which allow investors to trade the DJIA as a single security, rather than having to buy shares in all 30 constituent companies. A leading example is the SPDR Dow Jones Industrial Average ETF (DIA). DJIA futures contracts enable traders to speculate on the future value of the index and Options provide the right, but not the obligation, to buy or sell the index at a predetermined price in the future. Mutual funds enable investors to buy a share of a diversified portfolio of DJIA stocks thus providing exposure to the overall index.
Earnings of the week
Monday, December 11 – Oracle (ORCL)
Tuesday, December 12 – Johnson Controls International (JCI)
Wednesday, December 13 – Adobe (ADBE), ABM Industries (ABM)
Thursday, December 14 – Costco (COST), Jabil (JBL), Lennar (LEN)
Friday, December 15 – Darden Restaurants (DRI)
What they said about the market – Mark Kolanovic
JPMorgan’s Mark Kolanovic released a client note last Friday that explained the predicament that investors face heading into 2024. Ostensibly, risk assets need to decline in order to push the Fed to cut rates. But with indices already nearing all-time highs at the end of 2023, the central bank has little reason to help those risk assets by cutting rates in the near time. This leads Kolanovic to predict a rather dismal performance for the market next year, with equities underperforming bonds by 5% in an optimistic scenario.
“This is a catch-22 situation, in which risk assets can’t have a sustainable rally at this level of monetary restriction, and there will likely be no decisive easing unless risky assets correct (or inflation declines due to, for example, weaker demand, thus hurting corporate profits).”
S&P 500 forecast
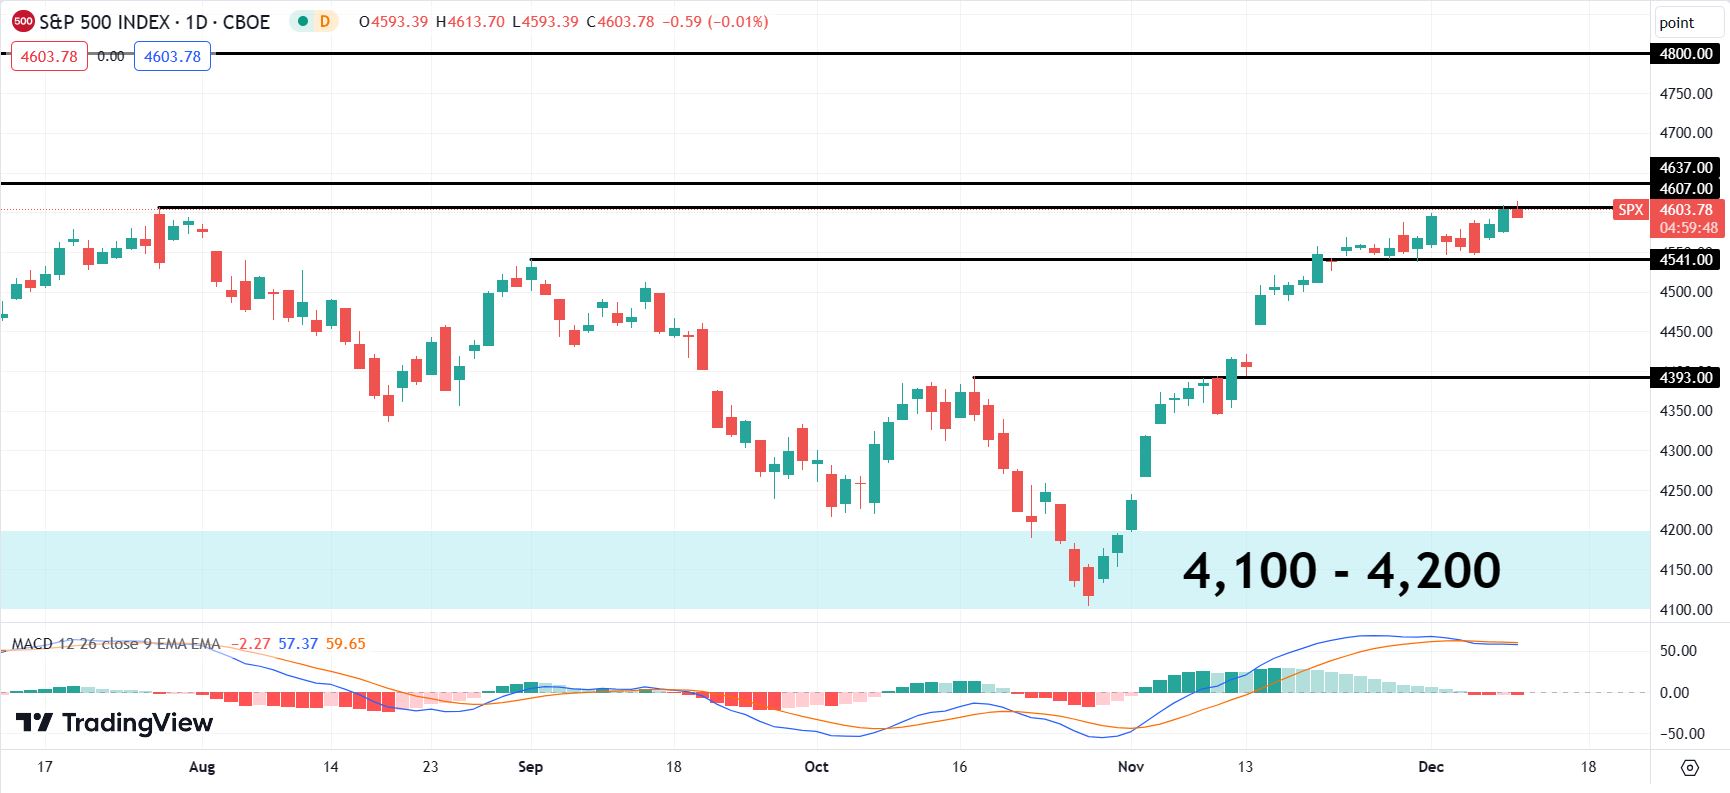
Reaching a new annual high in December bodes well for the index going into a new year. However, note that the S&P 500 has been moving mostly sideways of late after stringing together its fastest end to a correction in November in half a century.
Bulls have two more targets that arrive in quick succession. First, the 4,637 level stems from a range high in March 2022. Above there is the 4,800 resistance point from late December of 2021 and the first few days of January 2022.
It would be apropos for the S&P 500 to retest all-time highs almost exactly two years since its long-term downtrend was initiated. However, note that momentum is waning and the Moving Average Convergence Divergence (MACD) indicator has already crossed over in a bearish fashion.
S&P 500 daily chart