
Canadian Dollar pushes for further gains against US Dollar as WTI Crude Oil rebounds
- Canadian Dollar gains further ground against the US Dollar in risk-on markets.
- Bank of Canada Governor Macklem slated to make an appearance on Friday.
- WTI Crude Oil ticks up to $72, lifts CAD higher.
The Canadian Dollar (CAD) is extending into a second straight day of gains against the US Dollar (USD) on Thursday as global markets see a broad improvement in risk appetite. The US Federal Reserve (Fed) pivoted on Wednesday, putting rate cuts on the table for the first time in years, sending market sentiment soaring and the USD plunging to fresh lows. The US Dollar was the single worst-performing currency of the majors on Thursday, bolstering the CAD to eleven-week highs.
Economic data from Canada remains strictly limited to low-tier datasets on Thursday, and CAD traders will be looking out for Bank of Canada (BoC) Governor Tiff Macklem’s speech late Friday. BoC Governor Macklem will be giving a speech at the Canadian Club of Toronto, and the pre-written speech notes will be released at 17:25 GMT. Audience questions are expected at the event.
Daily Digest Market Movers: Canadian Dollar propped up by a slow bleed in US Dollar flows
- The CAD is benefiting from structural flows on multiple fronts.
- At the time of writing, the Canadian Dollar is up three-quarters of a percent against the US Dollar, and half a percent against the New Zealand Dollar (NZD).
- Despite Thursday’s gains, the CAD is down a third of a percent against the Pound Sterling (GBP) and a quarter of a percent against the Euro (EUR).
- A Fed-sponsored, broad-market USD sell-off is seeing a lift in nearly all risk assets.
- The Fed granted investors their wish on Wednesday, chalking in multiple rate cuts in 2024, and expects a 75 basis point decrease in the Fed rate by the end of next year.
- Markets are ignoring multiple data points to bid the week’s Fed action.
- US MoM Retail Sales for November printed well above expectations, showing a 0.3% increase versus the expected -0.1%, while October’s print saw a slight downside revision from -0.1% to -0.2%.
- Canadian Manufacturing Sales for October contracted steeper than expected, declining by 2.8% versus the forecasted 2.7% contraction, accelerating declines from September’s print of 0.7%, which also saw an upside revision from 0.4%, slightly steepening October’s decline.
- Crude Oil markets are on the mend with West Texas Intermediate (WTI) US Crude Oil climbing back to $72 per barrel.
- Crude Oil is catching a much-needed bid from Fed-inspired risk appetite, as well as declining barrel counts and a hopeful outlook from the Organization of the Petroleum Exporting Countries (OPEC).
Canadian Dollar price today
The table below shows the percentage change of Canadian Dollar (CAD) against listed major currencies today. Canadian Dollar was the strongest against the US Dollar.
| USD | EUR | GBP | CAD | AUD | JPY | NZD | CHF | |
| USD | -1.01% | -1.09% | -0.75% | -0.52% | -0.65% | -0.27% | -0.52% | |
| EUR | 1.00% | -0.06% | 0.26% | 0.48% | 0.35% | 0.73% | 0.48% | |
| GBP | 1.07% | 0.08% | 0.34% | 0.56% | 0.40% | 0.80% | 0.55% | |
| CAD | 0.75% | -0.27% | -0.34% | 0.22% | 0.07% | 0.46% | 0.21% | |
| AUD | 0.53% | -0.48% | -0.59% | -0.22% | -0.14% | 0.22% | -0.02% | |
| JPY | 0.66% | -0.34% | -0.39% | -0.09% | 0.13% | 0.39% | 0.14% | |
| NZD | 0.29% | -0.75% | -0.83% | -0.49% | -0.27% | -0.39% | -0.27% | |
| CHF | 0.55% | -0.48% | -0.55% | -0.22% | 0.01% | -0.15% | 0.25% |
The heat map shows percentage changes of major currencies against each other. The base currency is picked from the left column, while the quote currency is picked from the top row. For example, if you pick the Euro from the left column and move along the horizontal line to the Japanese Yen, the percentage change displayed in the box will represent EUR (base)/JPY (quote).
Technical Analysis: Canadian Dollar topside snap extends on Thursday, USD/CAD pierces 1.3400
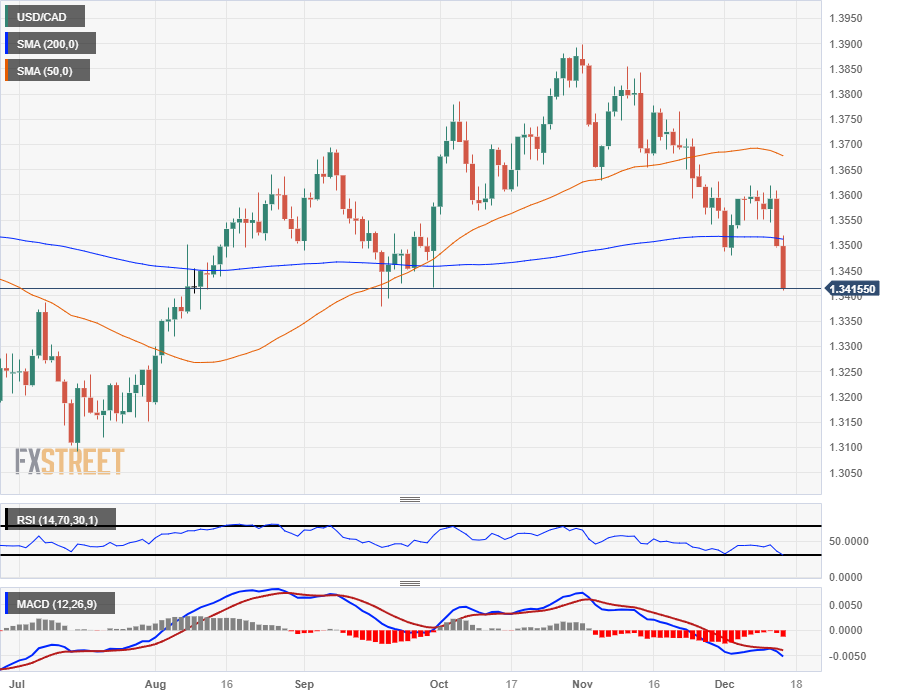
The Canadian Dollar (CAD) is seeing a firm recovery against the US Dollar (USD) extend into a second straight day, sending the USD/CAD further across the 200-day Simple Moving Average (SMA) near 1.3500 as the pair briefly pierces the 1.3400 handle on Thursday.
USD/CAD’s clean break of the 200-day SMA on Wednesday is extending, and Loonie bidders will be looking to push as far as they can toward July’s swing lows near 1.3100, with the low for 2023 etched in at 1.3092.
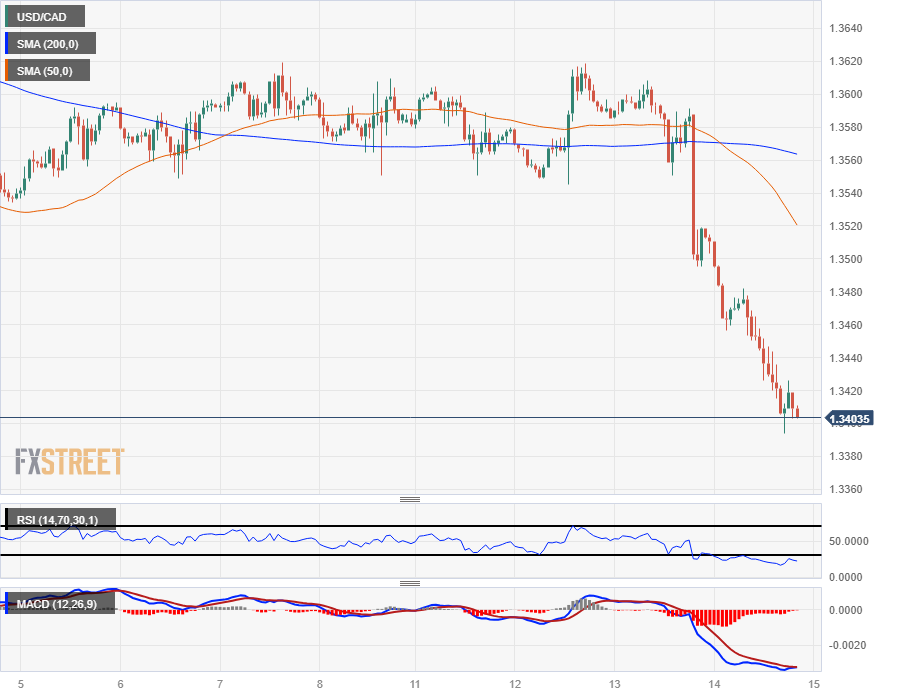
Near-term bearish acceleration sees the USD/CAD peeling away from intraday moving averages, with the 200-hour SMA just above 1.3560 and the 50-hour SMA accelerating into the low end after a bearish cross of the longer moving average. This proves to be a technical ceiling for any potential pullbacks into the chart region between 1.3540 and the 1.3500 handle.
USD/CAD Hourly Chart
USD/CAD Daily Chart
Fed FAQs
Monetary policy in the US is shaped by the Federal Reserve (Fed). The Fed has two mandates: to achieve price stability and foster full employment. Its primary tool to achieve these goals is by adjusting interest rates.
When prices are rising too quickly and inflation is above the Fed’s 2% target, it raises interest rates, increasing borrowing costs throughout the economy. This results in a stronger US Dollar (USD) as it makes the US a more attractive place for international investors to park their money.
When inflation falls below 2% or the Unemployment Rate is too high, the Fed may lower interest rates to encourage borrowing, which weighs on the Greenback.
The Federal Reserve (Fed) holds eight policy meetings a year, where the Federal Open Market Committee (FOMC) assesses economic conditions and makes monetary policy decisions.
The FOMC is attended by twelve Fed officials – the seven members of the Board of Governors, the president of the Federal Reserve Bank of New York, and four of the remaining eleven regional Reserve Bank presidents, who serve one-year terms on a rotating basis.
In extreme situations, the Federal Reserve may resort to a policy named Quantitative Easing (QE). QE is the process by which the Fed substantially increases the flow of credit in a stuck financial system.
It is a non-standard policy measure used during crises or when inflation is extremely low. It was the Fed’s weapon of choice during the Great Financial Crisis in 2008. It involves the Fed printing more Dollars and using them to buy high grade bonds from financial institutions. QE usually weakens the US Dollar.
Quantitative tightening (QT) is the reverse process of QE, whereby the Federal Reserve stops buying bonds from financial institutions and does not reinvest the principal from the bonds it holds maturing, to purchase new bonds. It is usually positive for the value of the US Dollar.