US equities close lower after a sharp turnaround late Wednesday, S&P 500 falls 1.5%
- US equities closed sharply lower, snapping the post-Fed pivot rally.
- S&P 500 inched within half a percent of all-time highs before a harsh correction.
- Dow abruptly ends a nine-day winning streak.
The Standard & Poor’s (S&P) 500 major equity index sharply reversed late Wednesday to close the day down almost 1.5% after coming within half a percent of setting a new all-time high. US equities declined in a harsh pullback on Wednesday after markets pared back a recent rally sparked by the Fed’s policy pivot last week.
US stocks rallied on runaway expectations of Federal Reserve (Fed) rate cuts next year after the Fed admitted that the rate hike cycle is truly over, and the Fed dot plot of interest rate expectations shifted to include up to three rate cuts next year for 75 basis points.
Market expectations surged after the Fed met the market halfway, sending the Dow Jones Industrial Average (DJIA) into a new all-time high. Money markets are pricing in over six rate cuts for an eye-watering 150 basis points in rate cuts in 2024, with a 21% chance of a rate cut as soon as March.
Fed pivot sparks rally, but upside momentum meets abrupt end on Wednesday
Fed officials have been taking turns splashing cold water on overactive investor imaginations, and the efforts appear to have paid off late Wednesday, sending equities lower across the board with all major indices declining sharply.
The S&P and the NASDAQ both fell around one and a half percent, shedding 70 and 225.28 points respectively. The S&P slipped back below the $4,700 handle to close the day at $4,698.35 while the NASDAQ wrapped up Wednesday down to $14,777. The DJIA also lost a little over one and a quarter percent to shed 475 points and end the mid-week market session at $37,082.
Markets head into the back half of the trading week with US Gross Domestic Product (GDP) figures slated for Thursday, with Friday set for one last print of high-impact inflation, consumer demand, and economic expectations figures with US Personal Consumption Expenditure (PCE) Price Index, Durable Goods Orders, and December’s Michigan Consumer Sentiment Index.
S&P 500 Technical Outlook
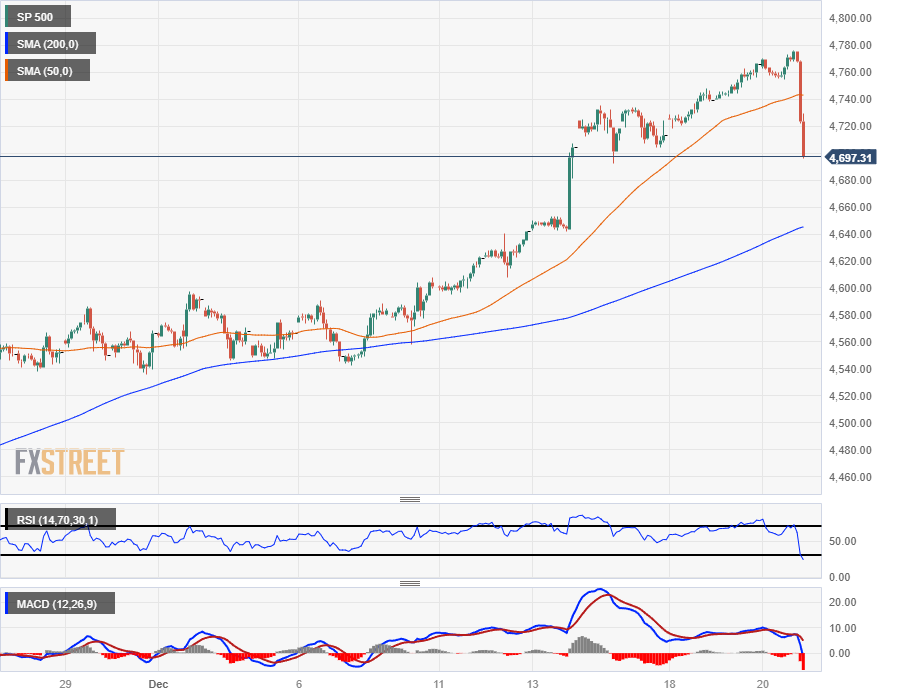
The S&P’s sharp decline late Wednesday has the major index tumbling towards the 200-hour Simple Moving Average (SMA) just above $4,640, and intraday price action has the S&P 500 trading well above the last meaningful swing low into $4,540.
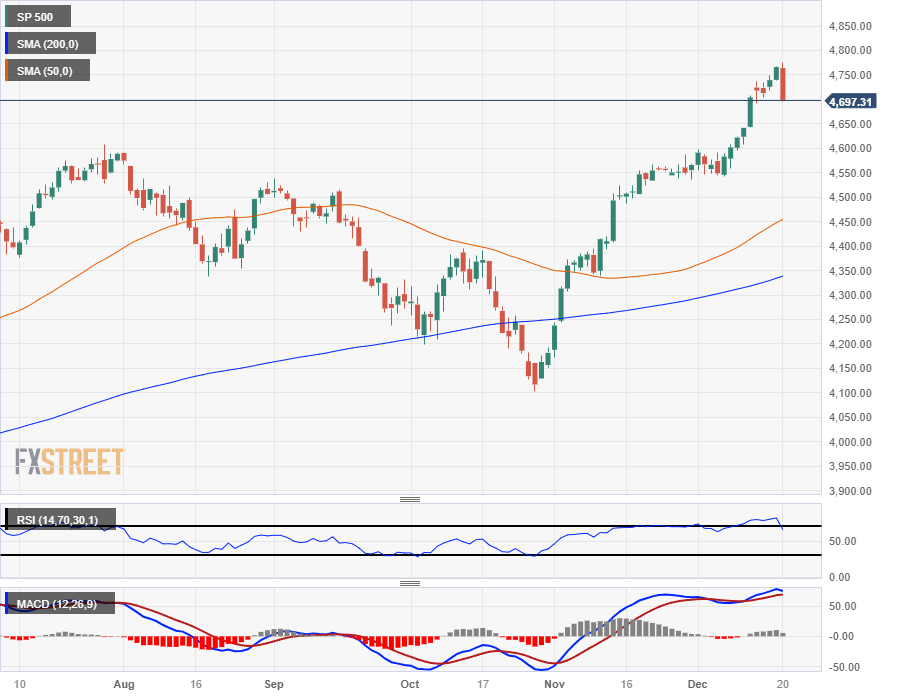
On the daily candlesticks, The S&P 500 has snapped its recent winning streak and is poised for its first weekly loss since October, having closed in the green for seven consecutive weeks.
The long-term 200-day SMA is drifting higher into the $4,350 neighborhood, and the closest technical support point rests at the 50-day SMA just above $4,450.
S&P 500 Hourly Chart
S&P 500 Daily Chart