
Shaking SPY tree

Swing traders needn‘t worry, but I was really cautious in our intraday channel yesterday. First slowly, then suddenly the bid evaporated – but client gains were protected. As the best explanation of what happened – whenever the boat is tilting too much one way, and this bull run had been heavily extended for a while, considering how far stocks advanced since end of Oct – I‘m releasing today‘s premium S&P 500 chart that gives you my proper intermarket view from a very short term perspective, together with stock market expectations once we make it through the opening days of 2024.
Forget not about tomorrow‘s core PCE (let alone today‘s set of data where lower GDP is bullish risk taking) and the lower volumes making for greater volatility – such a hit rarely comes unaccompanied… This is how I summed it up in our intraday channel.
Let‘s move right into the charts – today‘s full scale article contains 3 of them, featuring S&P 500, precious metals and oil.
Tired of seeing those red boxes instead of way more valuable information? Try the premium services based on what and how you trade.
S&P 500 and Nasdaq outlook
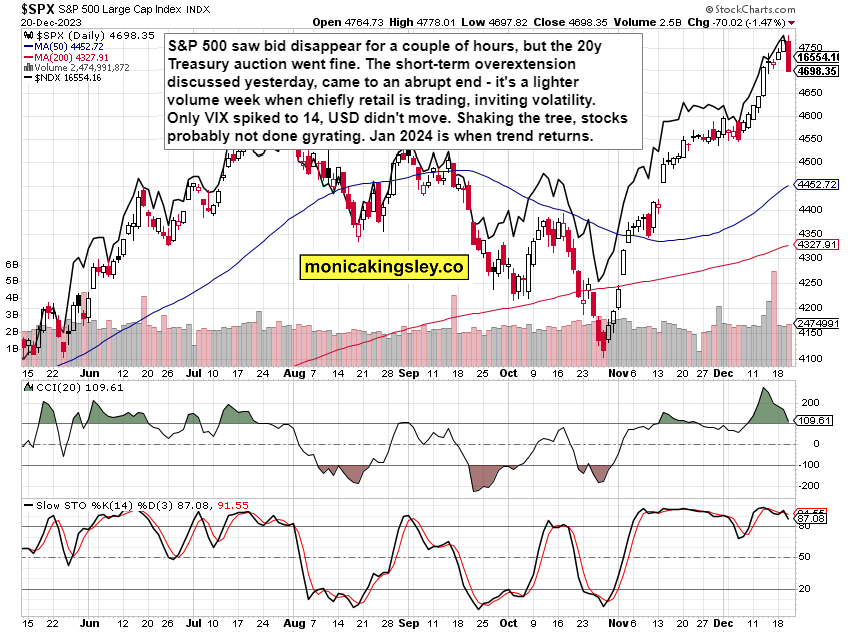
My 4,735 (let alone 4,715) support level hasn‘t been reached, and the heavy selling affected all sectors quite equally, with the exception of XLC that had been my sectoral pick to outperform S&P 500 (among the non interest rate sensitive plays) for quite a while.