UK Gross Domestic Product Preview: Another contraction could put BoE against the ropes

- The UK GDP is foreseen posting a marginal contraction in Q4.
- The Bank of England expects Gross Domestic Product to gradually regain its pace in the next few quarters.
- Pound Sterling risks extra losses while below the 200-day SMA.
The UK’s Office for National Statistics (ONS) will release the advanced prints of the Q4 Gross Domestic Product (GDP) on Thursday.
At the Bank of England’s (BoE) latest gathering, the Monetary Policy Committee (MPC) anticipates a slow but steady uptick in GDP growth over the upcoming quarters.
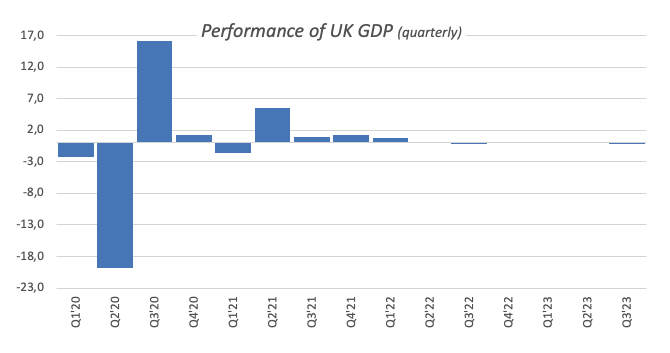
If GDP prints meet markets’ consensus, the UK economy would have entered into a “technical recession” following the 0.1% contraction recorded in the previous quarter.
In addition, BoE’s officials suggested that approximately two-thirds of the effect of heightened interest rates on GDP levels have already materialized.
According to investors’ projections, the BoE is expected to be one of the latest central banks to start reducing its policy rates. On this, while traders see the Federal Reserve (Fed) and the European Central Bank (ECB) cutting rates around the summer, the “Old Lady” is seen kicking off its easing cycle later in the year, with the September meeting being a likely candidate.
Projections for the UK GDP
The Office for National Statistics (ONS) reported that the UK economy contracted 0.1% QoQ in the previous quarter, compared with the 0.2% gain posted in the April-June period of the previous year. In the three months to December, the economy is expected to have also contracted 0.1%.
In its latest meeting, the BoE downgraded its forecast for economic growth and now expects GDP to come in flat in Q1 2024.
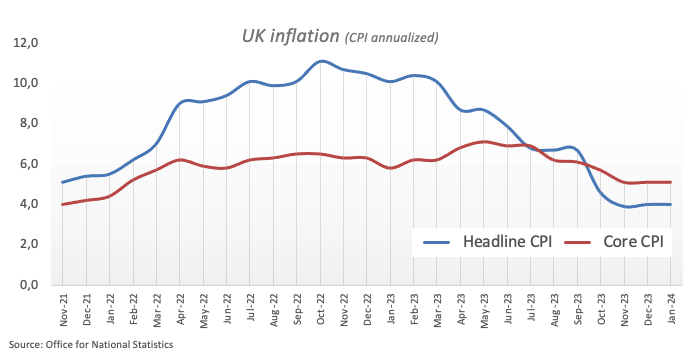
At present, the UK’s Consumer Price Index (CPI) inflation continues to rank among the highest within prominent global economies. As indicated by the most recent ONS report, in January, the headline CPI experienced a year-on-year increase of 4.0%, holding steady from the December reading. Meanwhile, the core CPI remained sticky and rose 5.1% year-on-year.
When will the UK release Q3 Gross Domestic Product, and how could it affect GBP/USD?
The UK will release the Q4 Gross Domestic Product (GDP) flash estimate on Thursday, February 15, at 7:00 GMT. The economy is expected to have shrunk 0.1% in the three months to December. On a monthly basis, the GDP is foreseen to contract by 0.2% in December, declining from 0.3% expansion in November.
In January, inflation in the UK turned out to be lower than anticipated, with inflationary pressures showing less of an increase than both markets and the BoE had expected. The CPI figures prompted a reassessment of expectations regarding the central bank’s intentions to start trimming its policy rate and market participants now see the likelihood of 75 bps rate cuts this year.
Pablo Piovano, US Session Manager and Senior Analyst at FXStreet, says: “Breaching the 2024 low of 1.2518, recorded on February 5, exposes GBP/USD to further losses to, initially, the December 2023 bottom of 1.2500 seen on December 13. The breakdown of this region could prompt a potential test of the weekly low of 1.2187 printed on November 10, 2023, to re-emerge on the horizon. On the other hand, the weekly top at 1.2683 seen on February 13 should offer initial resistance and is considered the latest defence for a probable climb to the 2024 peak at 1.2785 clocked on January 12.”
Piovano adds: “A convincing breach of the key 200-day SMA, today at 1.2562, should open the door to the continuation of the downward bias, at least in the near-term horizon.”
Economic Indicator
United Kingdom Gross Domestic Product (YoY)
The Gross Domestic Product (GDP), released by the Office for National Statistics on a monthly and quarterly basis, is a measure of the total value of all goods and services produced in the UK during a given period. The GDP is considered as the main measure of UK economic activity. The YoY reading compares economic activity in the reference quarter compared with the same quarter a year earlier. Generally speaking, a rise in this indicator is bullish for the Pound Sterling (GBP), while a low reading is seen as bearish.
Pound Sterling price today
The table below shows the percentage change of Pound Sterling (GBP) against listed major currencies today. Pound Sterling was the weakest against the Australian Dollar.
| USD | EUR | GBP | CAD | AUD | JPY | NZD | CHF | |
| USD | -0.05% | 0.33% | -0.08% | -0.37% | -0.01% | -0.32% | -0.02% | |
| EUR | 0.06% | 0.40% | 0.00% | -0.31% | 0.03% | -0.26% | 0.03% | |
| GBP | -0.33% | -0.40% | -0.41% | -0.69% | -0.35% | -0.65% | -0.35% | |
| CAD | 0.11% | 0.00% | 0.39% | -0.30% | 0.06% | -0.25% | 0.04% | |
| AUD | 0.36% | 0.31% | 0.70% | 0.29% | 0.35% | 0.05% | 0.34% | |
| JPY | 0.01% | -0.06% | 0.33% | -0.06% | -0.37% | -0.31% | -0.01% | |
| NZD | 0.33% | 0.25% | 0.65% | 0.25% | -0.05% | 0.30% | 0.31% | |
| CHF | 0.02% | -0.03% | 0.36% | -0.03% | -0.33% | 0.02% | -0.29% |
The heat map shows percentage changes of major currencies against each other. The base currency is picked from the left column, while the quote currency is picked from the top row. For example, if you pick the Euro from the left column and move along the horizontal line to the Japanese Yen, the percentage change displayed in the box will represent EUR (base)/JPY (quote).

