USD/CAD Price Analysis: Depreciates to near 1.3500 followed by 23.6% Fibonacci

- USD/CAD loses ground to a major level of 1.3500 on Tuesday.
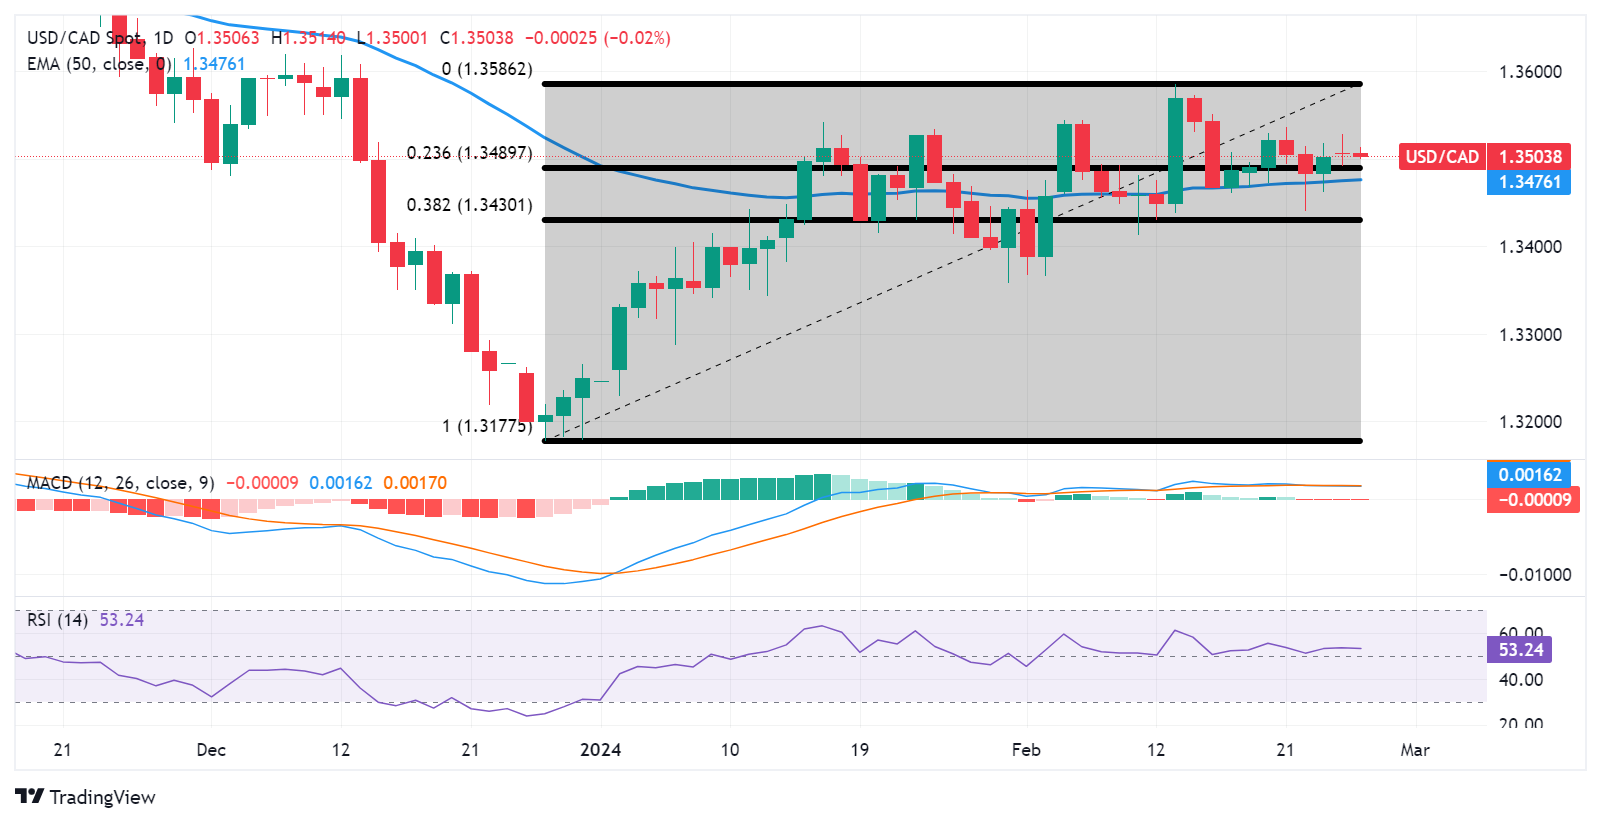
- The immediate support area appears around the 23.6% Fibonacci retracement level at 1.3489 and 50-day EMA at 1.3476.
- The pair could find immediate resistance around the major level of 1.3550 and February’s high at 1.3586.
USD/CAD continues to lose ground on the subdued US Dollar (USD), which could be attributed to the lower US Treasury yields. The USD/CAD pair inches lower to near 1.3500 during the Asian session on Tuesday.
The USD/CAD pair could find the immediate support region around the 23.6% Fibonacci retracement level at 1.3489 and the 50-day Exponential Moving Average (EMA) at 1.3476. A break below the latter could prompt the pair to approach the major level of 1.3450 before the 38.2% Fibonacci retracement level at 1.3430. Further support appears at the psychological support at the 1.3400 level.
The technical analysis of the 14-day Relative Strength Index (RSI) is positioned above 50, suggesting bullish momentum for the USD/CAD pair.
Furthermore, the Moving Average Convergence Divergence (MACD) indicator for the USD/CAD pair, indicates a subdued momentum in the market. This interpretation is based on the MACD line’s position above the centerline but lies below the signal line. Traders could await a clearer directional signal from the lagging indicator MACD before making aggressive trades in the pair.
On the upside, the USD/CAD pair could meet the key resistance at the major level of 1.3550 following February’s high at 1.3586. A break above February’s high could exert upward support to lead the pair to explore the region around the psychological resistance level at 1.3600.
