
USD/CAD climbs into ten-week high above 1.3600, but mixed US GDP caps gains
- USD/CAD flubs recovery above 1.3600 due to mixed US Q4 GDP.
- Canada sees soured Current Account print that misses expectations.
- Thursday’s Canada GDP to be eclipsed by US PCE.
USD/CAD saw an early Wednesday rally above the 1.3600 handle pull back into recent congestion after US Gross Domestic Product (GDP) figures were mixed on release. Markets will be pivoting to focus on Thursday’s US Personal Consumption Expenditure Price Index (PCE) as the Federal Reserve’s (Fed) inflation metric of choice.
Canada saw a worse-than-expected print in the fourth quarter Current Account, but the figure still recovered from the previous decline. Canadian Q4 GDP is also slated for Thursday, but it is set to be entirely overshadowed by the US PCE inflation update.
Daily digest market movers: USD/CAD sours but still on the high side
- Canada’s Q4 Current Account came in at -1.62 billion, missing the forecast recovery of -1.25 billion but still improved on the previous quarter’s -4.74 billion, which was revised lower from -3.22 billion.
- US Q4 GDP accelerated QoQ to 1.7% from the previous 1.5%.
- Annualized Q4 US GDP ticked lower to 3.2% from the steady forecast of 3.3% after late revisions to Q1 GDP dragged the yearly average lower.
- Read more: US Q4 GDP growth revised lower to 3.2% from 3.3%.
- Early US PCE numbers came in slightly higher than expected, with QoQ Core PCE for Q4 rising to 2.1% from the forecasted flat print at 2.0%, and PCE Prices ticked up to 1.8% from the expected flat print at 1.7%.
- Markets will be pivoting to Thursday’s US PCE Price Index, scheduled for 13:30 GMT.
- US Core PCE Preview: Forecasts from nine major banks, a hot reading.
- Core PCE Price Index for the year ended January is forecast to tick down to 2.8% from the previous 2.9%.
- Q4’s Canadian GDP Annualized is expected to rebound to 0.8% from the previous -1.1%.
Canadian Dollar price today
The table below shows the percentage change of Canadian Dollar (CAD) against listed major currencies today. Canadian Dollar was the weakest against the US Dollar.
| USD | EUR | GBP | CAD | AUD | JPY | NZD | CHF | |
| USD | 0.08% | 0.21% | 0.24% | 0.74% | 0.19% | 1.31% | 0.09% | |
| EUR | -0.06% | 0.15% | 0.17% | 0.69% | 0.12% | 1.25% | 0.03% | |
| GBP | -0.21% | -0.15% | 0.03% | 0.54% | -0.03% | 1.11% | -0.12% | |
| CAD | -0.24% | -0.18% | -0.05% | 0.51% | -0.05% | 1.05% | -0.12% | |
| AUD | -0.76% | -0.70% | -0.55% | -0.52% | -0.58% | 0.57% | -0.66% | |
| JPY | -0.18% | -0.15% | 0.02% | 0.06% | 0.57% | 1.15% | -0.09% | |
| NZD | -1.33% | -1.28% | -1.14% | -1.10% | -0.58% | -1.16% | -1.25% | |
| CHF | -0.09% | -0.03% | 0.12% | 0.15% | 0.63% | 0.09% | 1.23% |
The heat map shows percentage changes of major currencies against each other. The base currency is picked from the left column, while the quote currency is picked from the top row. For example, if you pick the Euro from the left column and move along the horizontal line to the Japanese Yen, the percentage change displayed in the box will represent EUR (base)/JPY (quote).
Technical analysis: USD/CAD hesitates on the top end after testing 1.3600
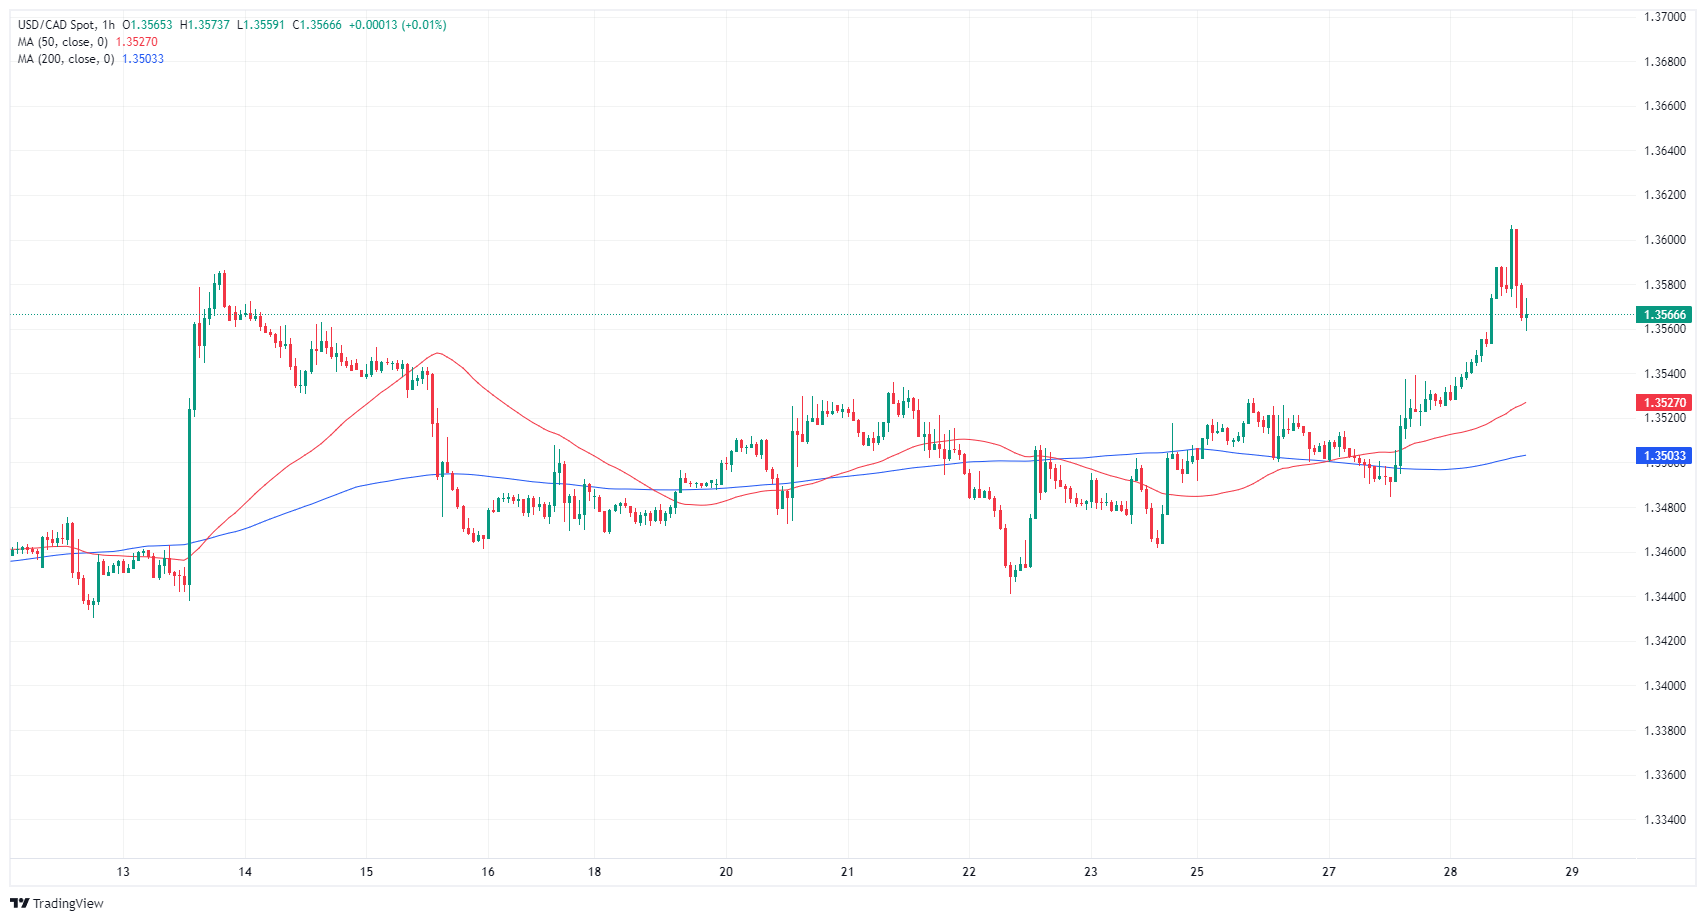
USD/CAD rallied on Wednesday, briefly crossing the 1.3600 handle before paring back into recent technical levels. The pair found a fresh ten-week high at 1.3606, but 1.3580 remains a tricky barrier to break.
Daily candlesticks continue to etch out a rough pattern of higher highs as momentum runs aground of the 200-day Simple Moving Average (SMA) at 1.3478. Despite near-term congestion, USD/CAD has closed in the green for all but one of the last eight consecutive weeks.
USD/CAD hourly chart
USD/CAD daily chart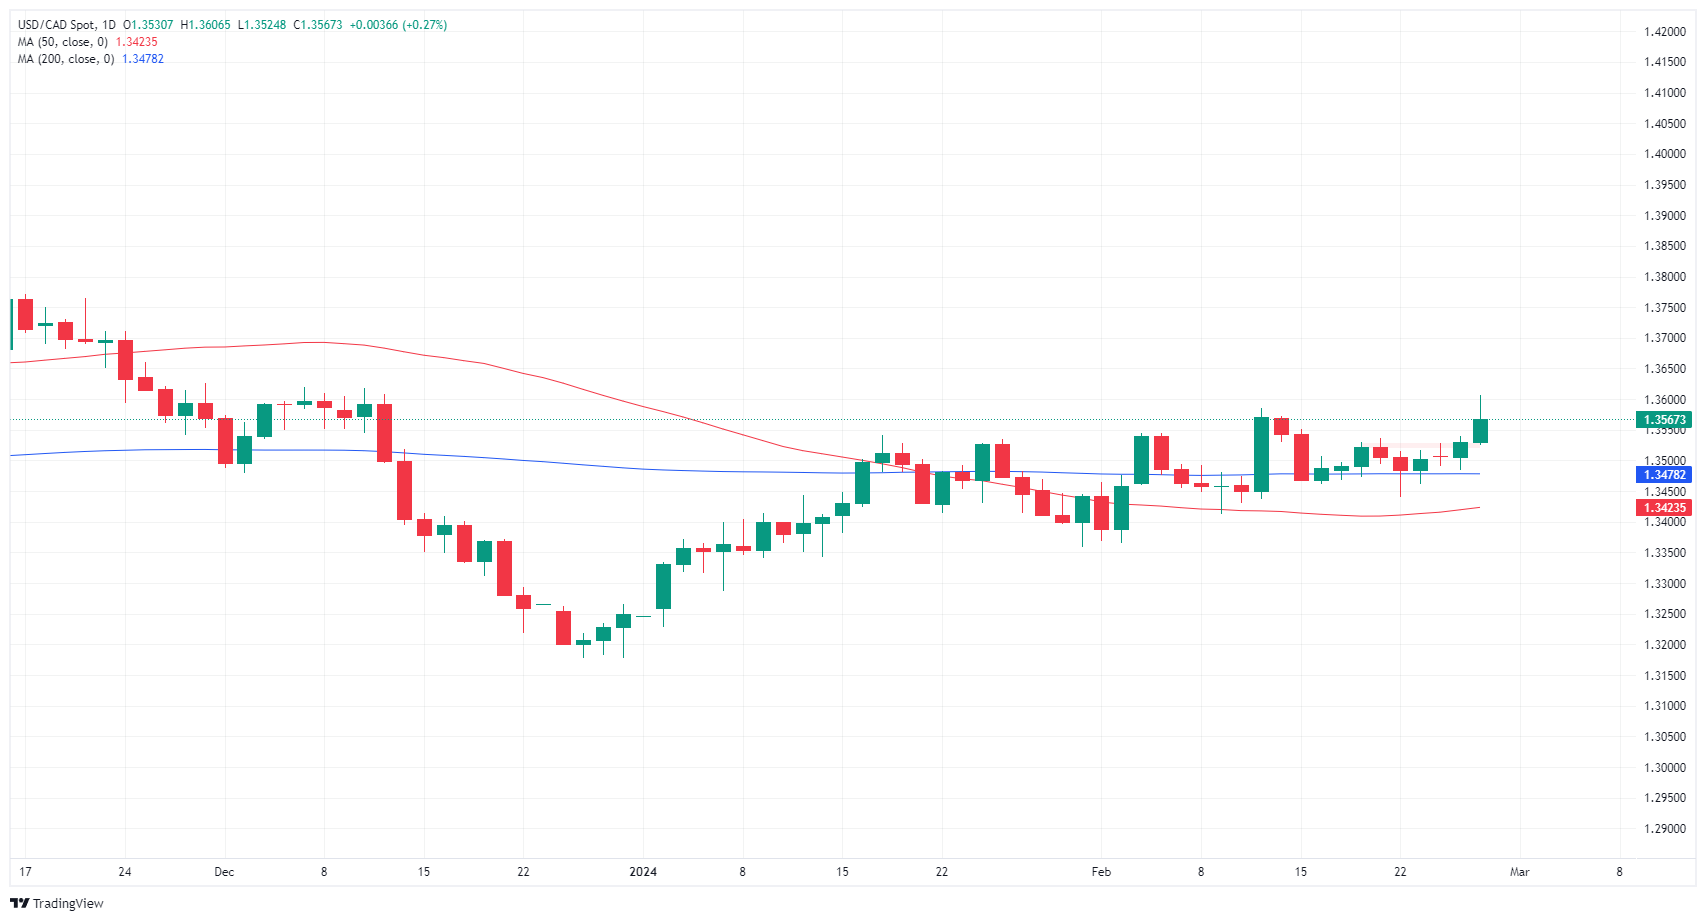
GDP FAQs
A country’s Gross Domestic Product (GDP) measures the rate of growth of its economy over a given period of time, usually a quarter. The most reliable figures are those that compare GDP to the previous quarter e.g Q2 of 2023 vs Q1 of 2023, or to the same period in the previous year, e.g Q2 of 2023 vs Q2 of 2022.
Annualized quarterly GDP figures extrapolate the growth rate of the quarter as if it were constant for the rest of the year. These can be misleading, however, if temporary shocks impact growth in one quarter but are unlikely to last all year – such as happened in the first quarter of 2020 at the outbreak of the covid pandemic, when growth plummeted.
A higher GDP result is generally positive for a nation’s currency as it reflects a growing economy, which is more likely to produce goods and services that can be exported, as well as attracting higher foreign investment. By the same token, when GDP falls it is usually negative for the currency.
When an economy grows people tend to spend more, which leads to inflation. The country’s central bank then has to put up interest rates to combat the inflation with the side effect of attracting more capital inflows from global investors, thus helping the local currency appreciate.
When an economy grows and GDP is rising, people tend to spend more which leads to inflation. The country’s central bank then has to put up interest rates to combat the inflation. Higher interest rates are negative for Gold because they increase the opportunity-cost of holding Gold versus placing the money in a cash deposit account. Therefore, a higher GDP growth rate is usually a bearish factor for Gold price.