
NZD/JPY Price Analysis: Bears exert pressure, possible bullish resurface observed

- The daily chart of the NZD/JPY suggests a growing selling momentum.
- In contrast, indicators at the hourly chart show a mild recovery, with an improving RSI.
- Whilst the pair have been subject to short-term selling pressure, the dominant bullish trend still prevails.
The NZD/JPY pair was trading at 91.36 in Thursday’s session, experiencing a decline of 0.18%. From a technical perspective, bearish signals are evident on the daily chart, whereas the hourly chart shows potential improvement.
On the daily chart, the Relative Strength Index (RSI) has been residing in negative territory for the past few sessions. The most recent RSI value stands at 45, indicating a slightly bearish bias daily. This bearish stance is further reinforced by the MACD, which shows rising red bars, indicating negative momentum in the pair.
NZD/JPY daily chart
However, when in the hourly chart, the RSI has been showing signs of improvement with the latest RSI level of 55 sitting in the positive territory. Despite this, the MACD is presenting green bars, indicating a steady positive momentum.
NZD/JPY hourly chart
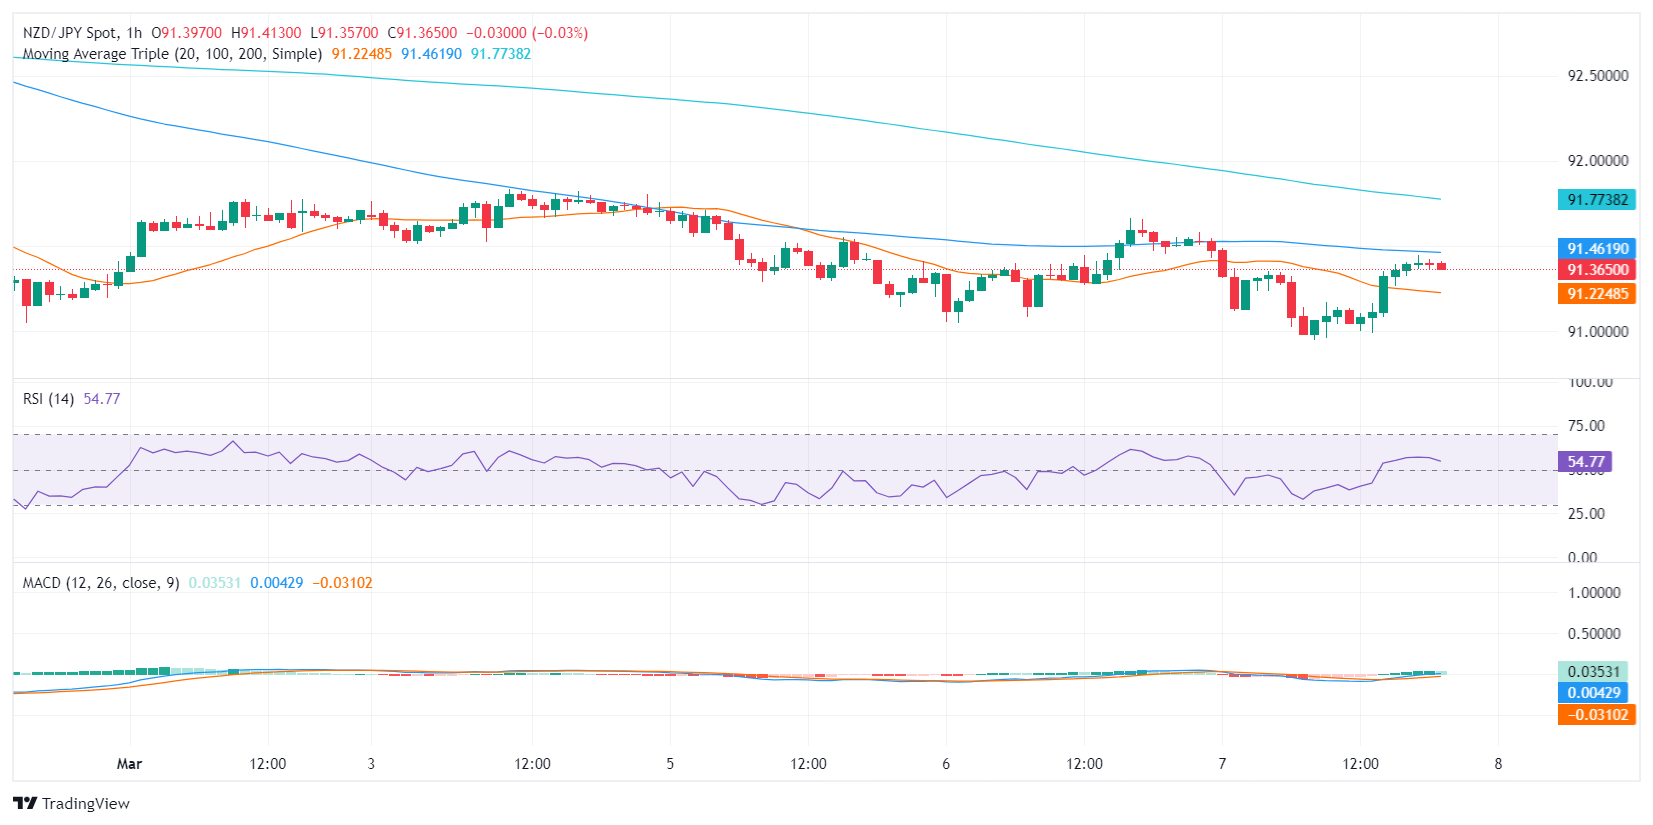
Regarding broader technical aspects, the NZD/JPY sits below its 20-day Simple Moving Average (SMA). However, it remains above its longer-term 100 and 200-day SMAs. This suggests that the longer-term bullish trend could still remain intact despite the recent short-term selling pressure. Thus, the divergence between the daily and hourly readings may imply that the underlying bullish bias could resurface, especially if the hourly indicators continue to improve.