
NZD/JPY Price Analysis: Bears maintain control, potential bullish shift on the horizon
- The daily chart indicates a supremacy of sellers, as depicted by the RSI’s continuation below 50 and a growing MACD negative momentum.
- Small signs of recovery are evident on the hourly chart.
- Despite hourly swings favoring the bulls, overall market bias in the NZD/JPY remains bearish.
The NZD/JPY is currently trading at 90.61, reflecting a slight decrease at the start of the week. Sellers continue to hold a strong dominance, which dictates a primarily negative technical outlook for the pair. However, the hourly chart reveals signs of buyers coming into play.
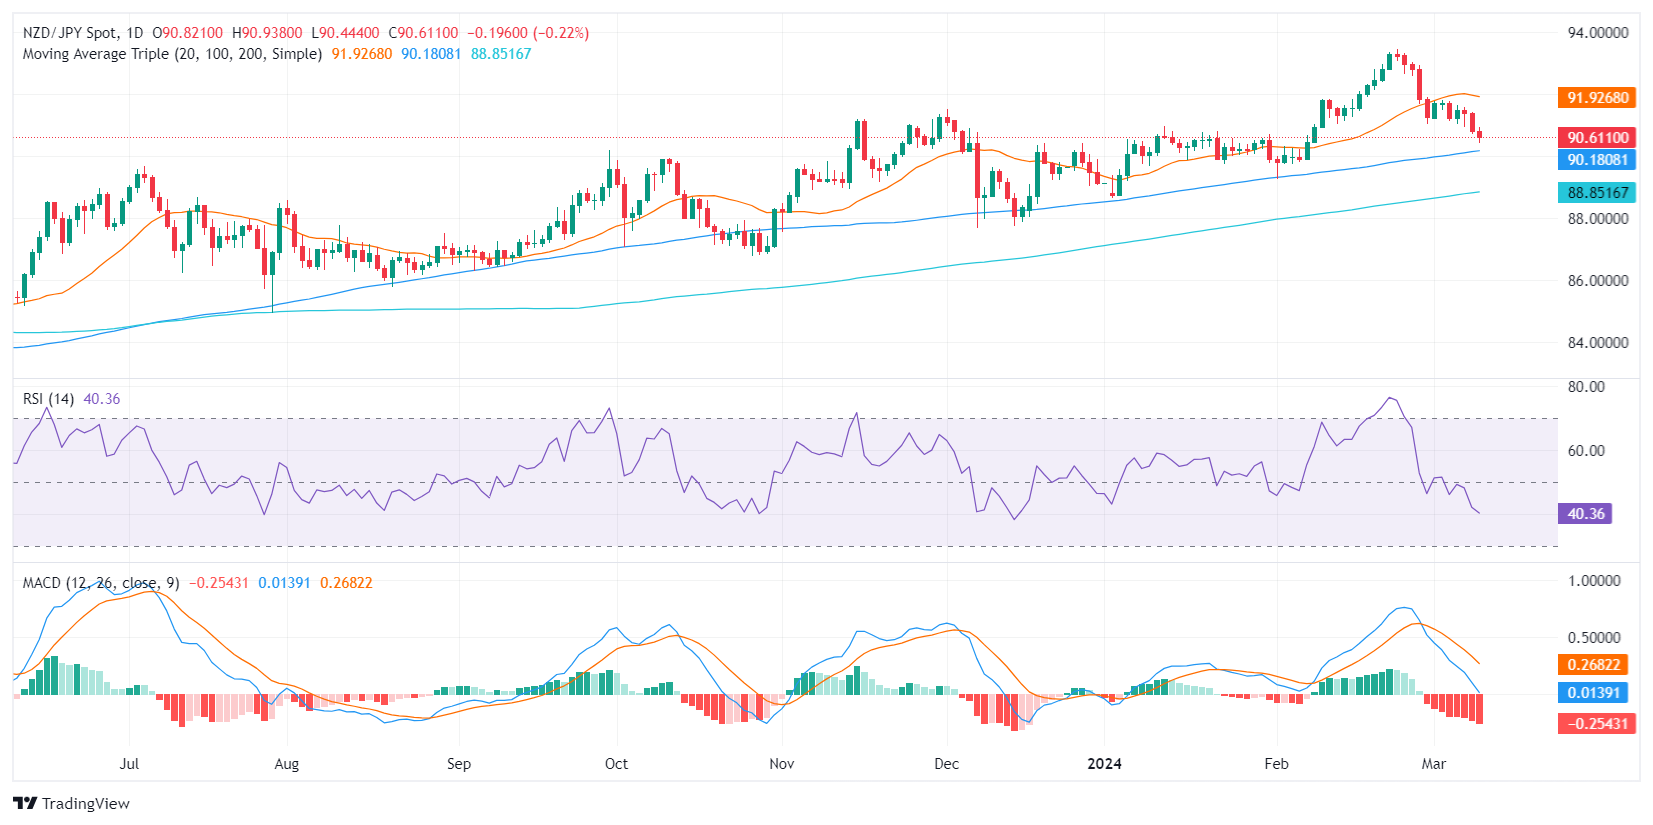
On the daily chart of the NZD/JPY pair, the Relative Strength Index (RSI) shows a positioning in negative territory. The consecutive decline of RSI from levels above 50 to 36 suggests that sellers currently command the market. In addition, the daily Moving Average Convergence Divergence (MACD) features rising red bars, indicating an increase in negative momentum, which further supports the sellers’ dominance.
NZD/JPY daily chart
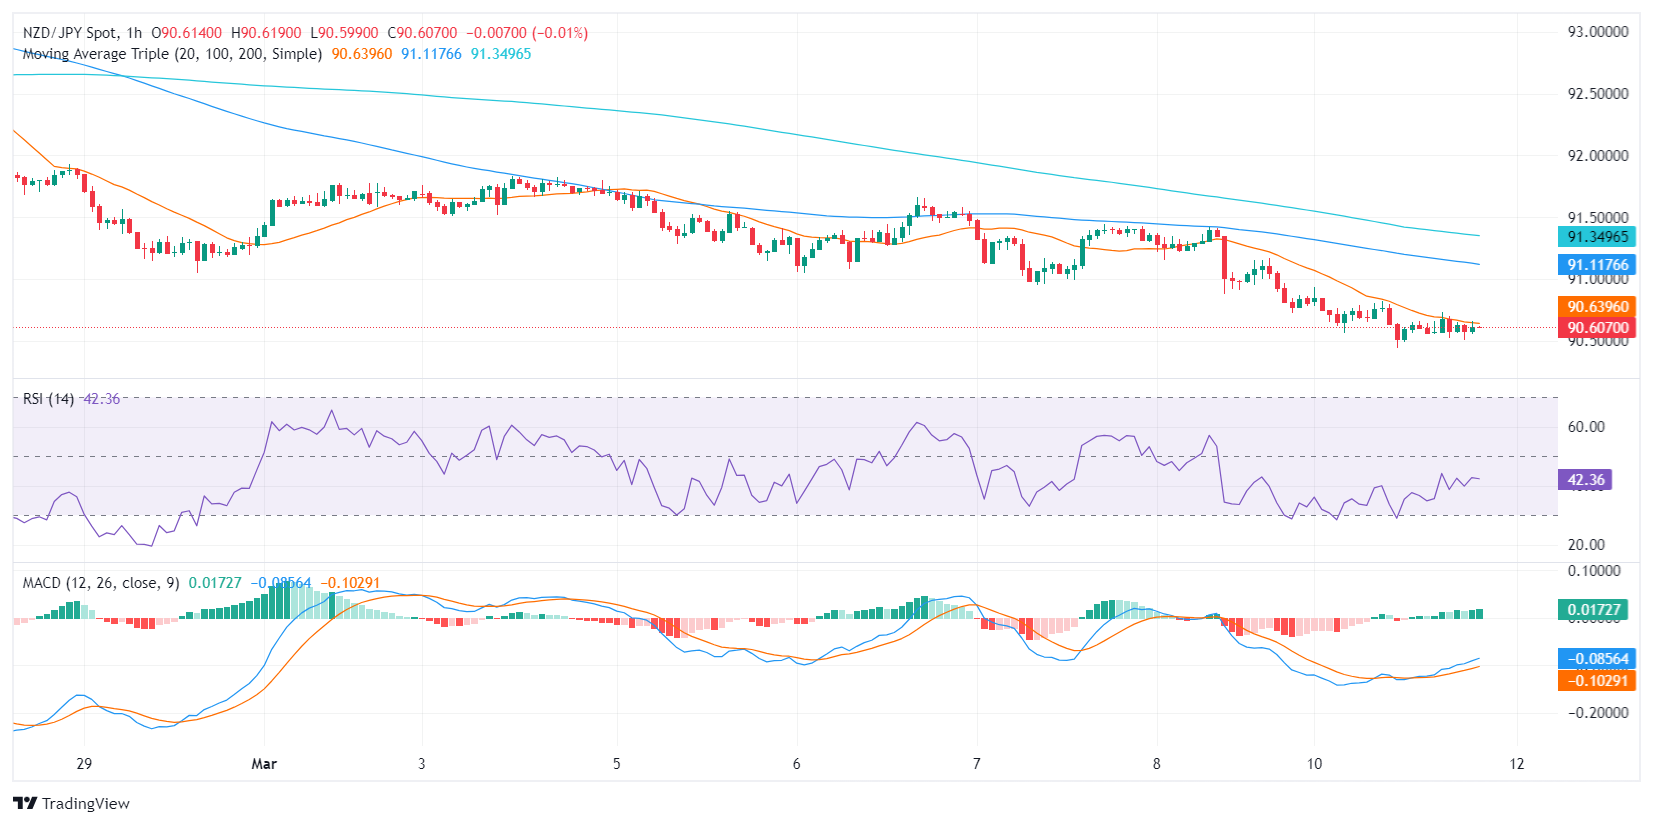
Contrarily, on the hourly chart, the RSI of the NZD/JPY shows a slight recovery near its middle point, with the latest reading being around 42. However, this minor upturn does not challenge the overall negative bias. The first signs of a positive swing are also noted in the MACD, with green bars suggesting positive momentum building in the short term.
NZD/JPY hourly chart
In conclusion, despite the slight positive swing observed in the hourly indicators, the overall market bias for the NZD/JPY remains negative as evidenced by the daily chart. The pair below the 20-day Simple Moving Average (SMA) suggests that the short-term outlook is negative. However, the positive divergence between the MACD and RSI on the hourly chart may imply a forthcoming bullish reversal, subject to further confirmation.