
USD/JPY steady, but on the low end as investors knuckle down for US CPI inflation
- USD/JPY remains just shy of 147.00 following last week’s declines.
- Japan’s Q4 GDP print early Monday missed the mark.
- US CPI inflation is expected to come in mixed.
USD/JPY kicked off the new week on the low side of the 147.00 handle, with the pair steeply off of March’s early highs above 150.00. Markets are geared up for Tuesday’s US CPI inflation print as investors continue to seek out signs the Federal Reserve (Fed) could be pushed into early rate cuts if inflation eases off rapidly enough.
Japan’s Q4 Gross Domestic Product (GDP) print came in below expectations, but managed to recover from the previous QoQ decline of -0.1%. Q4 GDP printed at 0.1%, missing the forecast 0.3%. Annualized Q4 GDP in Japan also missed the mark, coming in at 0.4% versus the forecast rebound of 1.1%, though GDP growth still improved from the previous figure of -0.4%.
US CPI Preview: Forecasts from 10 major banks, inflation still too high
February’s US MoM CPI print is expected to accelerate to 0.4% from 0.3% as uneven inflation continues to weigh. Core MoM CPI, which excludes food and energy prices, is expected to tick down to 0.3% from 0.4%.
Annualized CPI is forecast to hold at 3.1% with Core YoY CPI expected to come in at 0.3% versus the previous 0.4%.
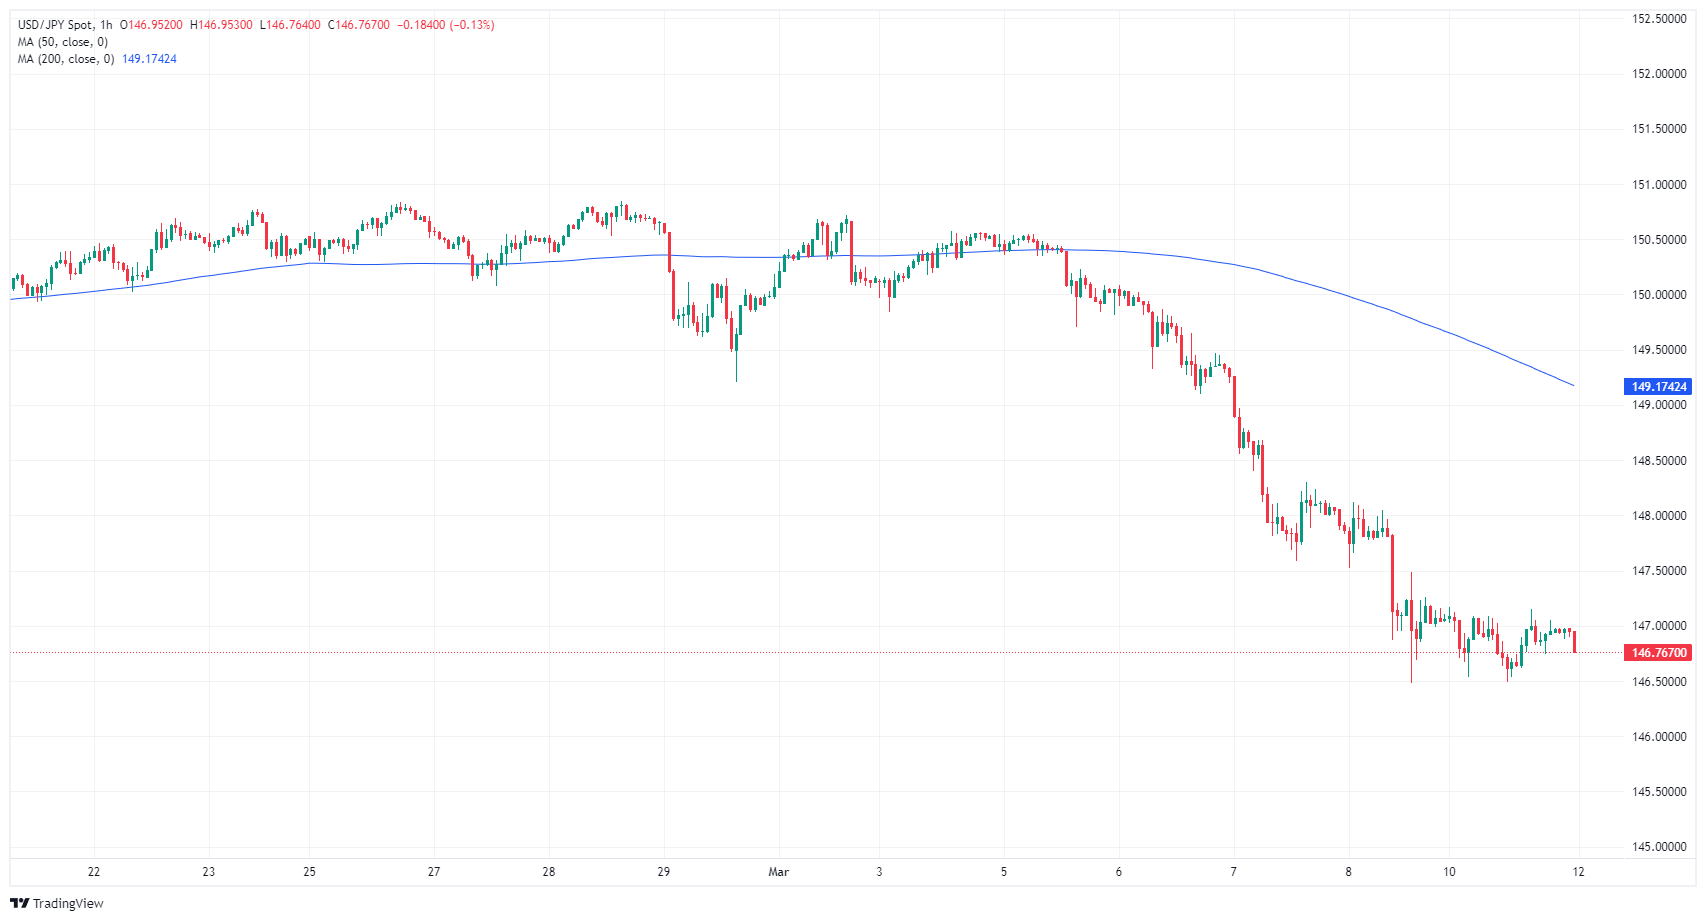
USD/JPY technical outlook
USD/JPY is notably on the week side heading into a new trading week, with the pair pinned on the south side of the 147.00 handle heading into the early Tuesday session. The pair is down over 2.5% from March’s peak bids near 150.70, with February’s all-time highs at 150.88.
Last week accelerated into the bearish side, extending a technical drag down the chart paper after the previous week snapped an eight-week winning streak. USD/JPY has closed flat or in the green for eight consecutive weeks, but now the pair is getting dragged back into bear country. The last meaningful technical floor sits at the last swing low into the 146.00 handle, with the 200-day Simple Moving Average (SMA) rising into 146.22.