Canadian Dollar flounders as Greenback bids bounce back on Thursday

- Canadian Dollar rises, but USD rises faster.
- Canada brings Retail Sales data to fore on Friday.
- US PMIs came in mixed on Thursday.
The Canadian Dollar (CAD) is broadly higher on Thursday, climbing against most of its major currency peers, but the US Dollar (USD) is getting bid higher, faster. Investors are paring back Greenback selling after a Fed-fueled midweek splurge, bolstering the US Dollar across the board.
Canada will return to the economic calendar with meaningful data on Friday. Retail Sales figures for January are expected to decline around half a percent after rising nearly a full percent in December.
Daily digest market movers: US Dollar dominates on US data flows
- US S&P Global Purchasing Managers Index (PMI) figures printed a split on Thursday.
- March’s US Manufacturing PMI rose to 52.5 from the previous 52.2, easily vaulting over the forecasted decline to 51.7.
- The Services PMI for March fell more than expected, declining to 51.7 from the previous month’s 52.3, falling more than the forecast 52.0.
- US Initial Jobless Claims slipped to 210K for the week ended March 15, missing the forecasted increase to 215K from the previous week’s 212K (revised upward from 209K).
- Analysts from Scotiabank have noted that the month of April tends to be the Canadian Dollar’s best-performing month against the Greenback.
- Scotiabank: April is the CAD’s best month of the calendar year against the USD
Canadian Dollar price today
The table below shows the percentage change of Canadian Dollar (CAD) against listed major currencies today. Canadian Dollar was the weakest against the US Dollar.
| USD | EUR | GBP | CAD | AUD | JPY | NZD | CHF | |
| USD | 0.71% | 1.03% | 0.45% | 0.39% | 0.61% | 0.71% | 1.50% | |
| EUR | -0.72% | 0.32% | -0.26% | -0.33% | -0.12% | 0.01% | 0.79% | |
| GBP | -1.05% | -0.33% | -0.59% | -0.63% | -0.45% | -0.32% | 0.46% | |
| CAD | -0.47% | 0.26% | 0.59% | -0.05% | 0.13% | 0.26% | 1.04% | |
| AUD | -0.40% | 0.32% | 0.64% | 0.06% | 0.19% | 0.33% | 1.10% | |
| JPY | -0.58% | 0.13% | 0.45% | -0.16% | -0.19% | 0.14% | 0.91% | |
| NZD | -0.71% | 0.00% | 0.32% | -0.26% | -0.33% | -0.10% | 0.80% | |
| CHF | -1.51% | -0.79% | -0.47% | -1.06% | -1.12% | -0.90% | -0.80% |
The heat map shows percentage changes of major currencies against each other. The base currency is picked from the left column, while the quote currency is picked from the top row. For example, if you pick the Euro from the left column and move along the horizontal line to the Japanese Yen, the percentage change displayed in the box will represent EUR (base)/JPY (quote).
Technical analysis: US Dollar rebounds, bullish CAD gets outperformed
The Canadian Dollar (CAD) is broadly higher on Thursday, gaining ground against nearly all of its major currency peers despite falling around four-tenths of a percent against the US Dollar. The CAD is struggling to hold flat against the day’s other over-performing currency, the Australian Dollar (AUD).
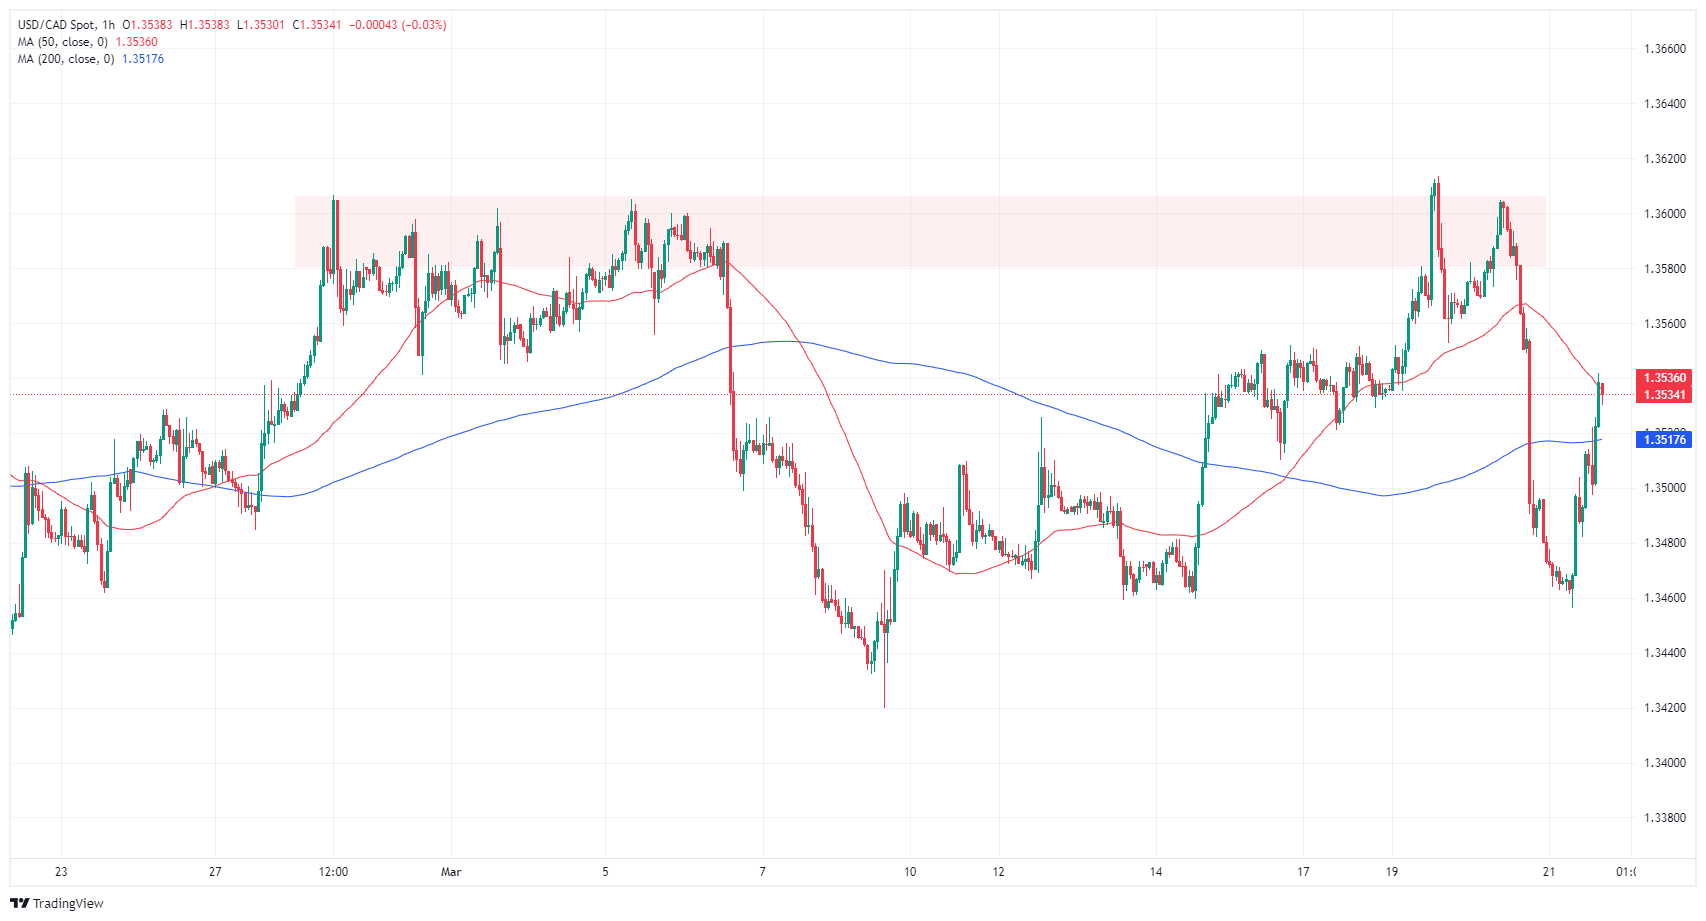
The USD/CAD is on the rise in Thursday trading, cutting in approximately 0.6% in bullish momentum bottom-to-top. The pair caught a bounce from the 1.3460 region, reclaiming the familiar 1.3500 handle in intraday trading.
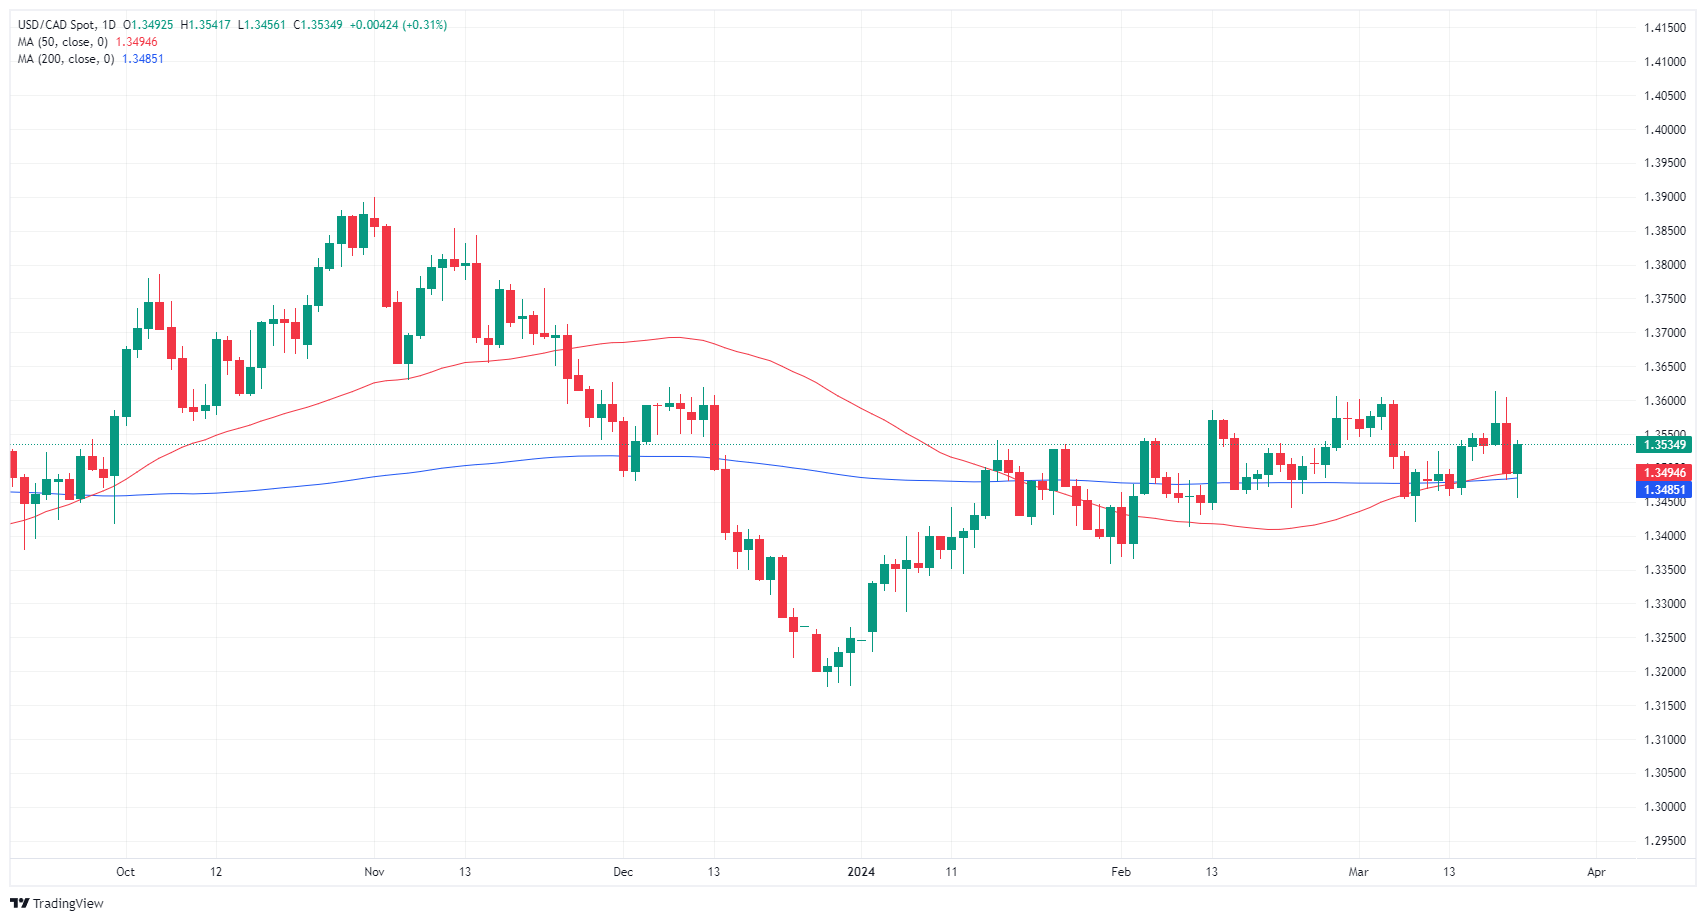
Thursday’s recovery etches in a technical rejection from the 200-day Simple Moving Average (SMA) at 1.3485. A rangebound USD/CAD pattern looks set to continue in the near term.
USD/CAD hourly chart
USD/CAD daily chart
Fed FAQs
Monetary policy in the US is shaped by the Federal Reserve (Fed). The Fed has two mandates: to achieve price stability and foster full employment. Its primary tool to achieve these goals is by adjusting interest rates. When prices are rising too quickly and inflation is above the Fed’s 2% target, it raises interest rates, increasing borrowing costs throughout the economy. This results in a stronger US Dollar (USD) as it makes the US a more attractive place for international investors to park their money. When inflation falls below 2% or the Unemployment Rate is too high, the Fed may lower interest rates to encourage borrowing, which weighs on the Greenback.
The Federal Reserve (Fed) holds eight policy meetings a year, where the Federal Open Market Committee (FOMC) assesses economic conditions and makes monetary policy decisions. The FOMC is attended by twelve Fed officials – the seven members of the Board of Governors, the president of the Federal Reserve Bank of New York, and four of the remaining eleven regional Reserve Bank presidents, who serve one-year terms on a rotating basis.
In extreme situations, the Federal Reserve may resort to a policy named Quantitative Easing (QE). QE is the process by which the Fed substantially increases the flow of credit in a stuck financial system. It is a non-standard policy measure used during crises or when inflation is extremely low. It was the Fed’s weapon of choice during the Great Financial Crisis in 2008. It involves the Fed printing more Dollars and using them to buy high grade bonds from financial institutions. QE usually weakens the US Dollar.
Quantitative tightening (QT) is the reverse process of QE, whereby the Federal Reserve stops buying bonds from financial institutions and does not reinvest the principal from the bonds it holds maturing, to purchase new bonds. It is usually positive for the value of the US Dollar.
