Silver Price Analysis: XAG/USD tips top of range and reverses lower

- Silver price rises up and tips the top of a long-term range before reversing lower.
- It has formed a Bearish Japanese candlestick pattern, enhancing the reversal thesis.
- A move back down to a cluster of MAs in the 23.000s is foreseen subject to a continuation of the weakness.
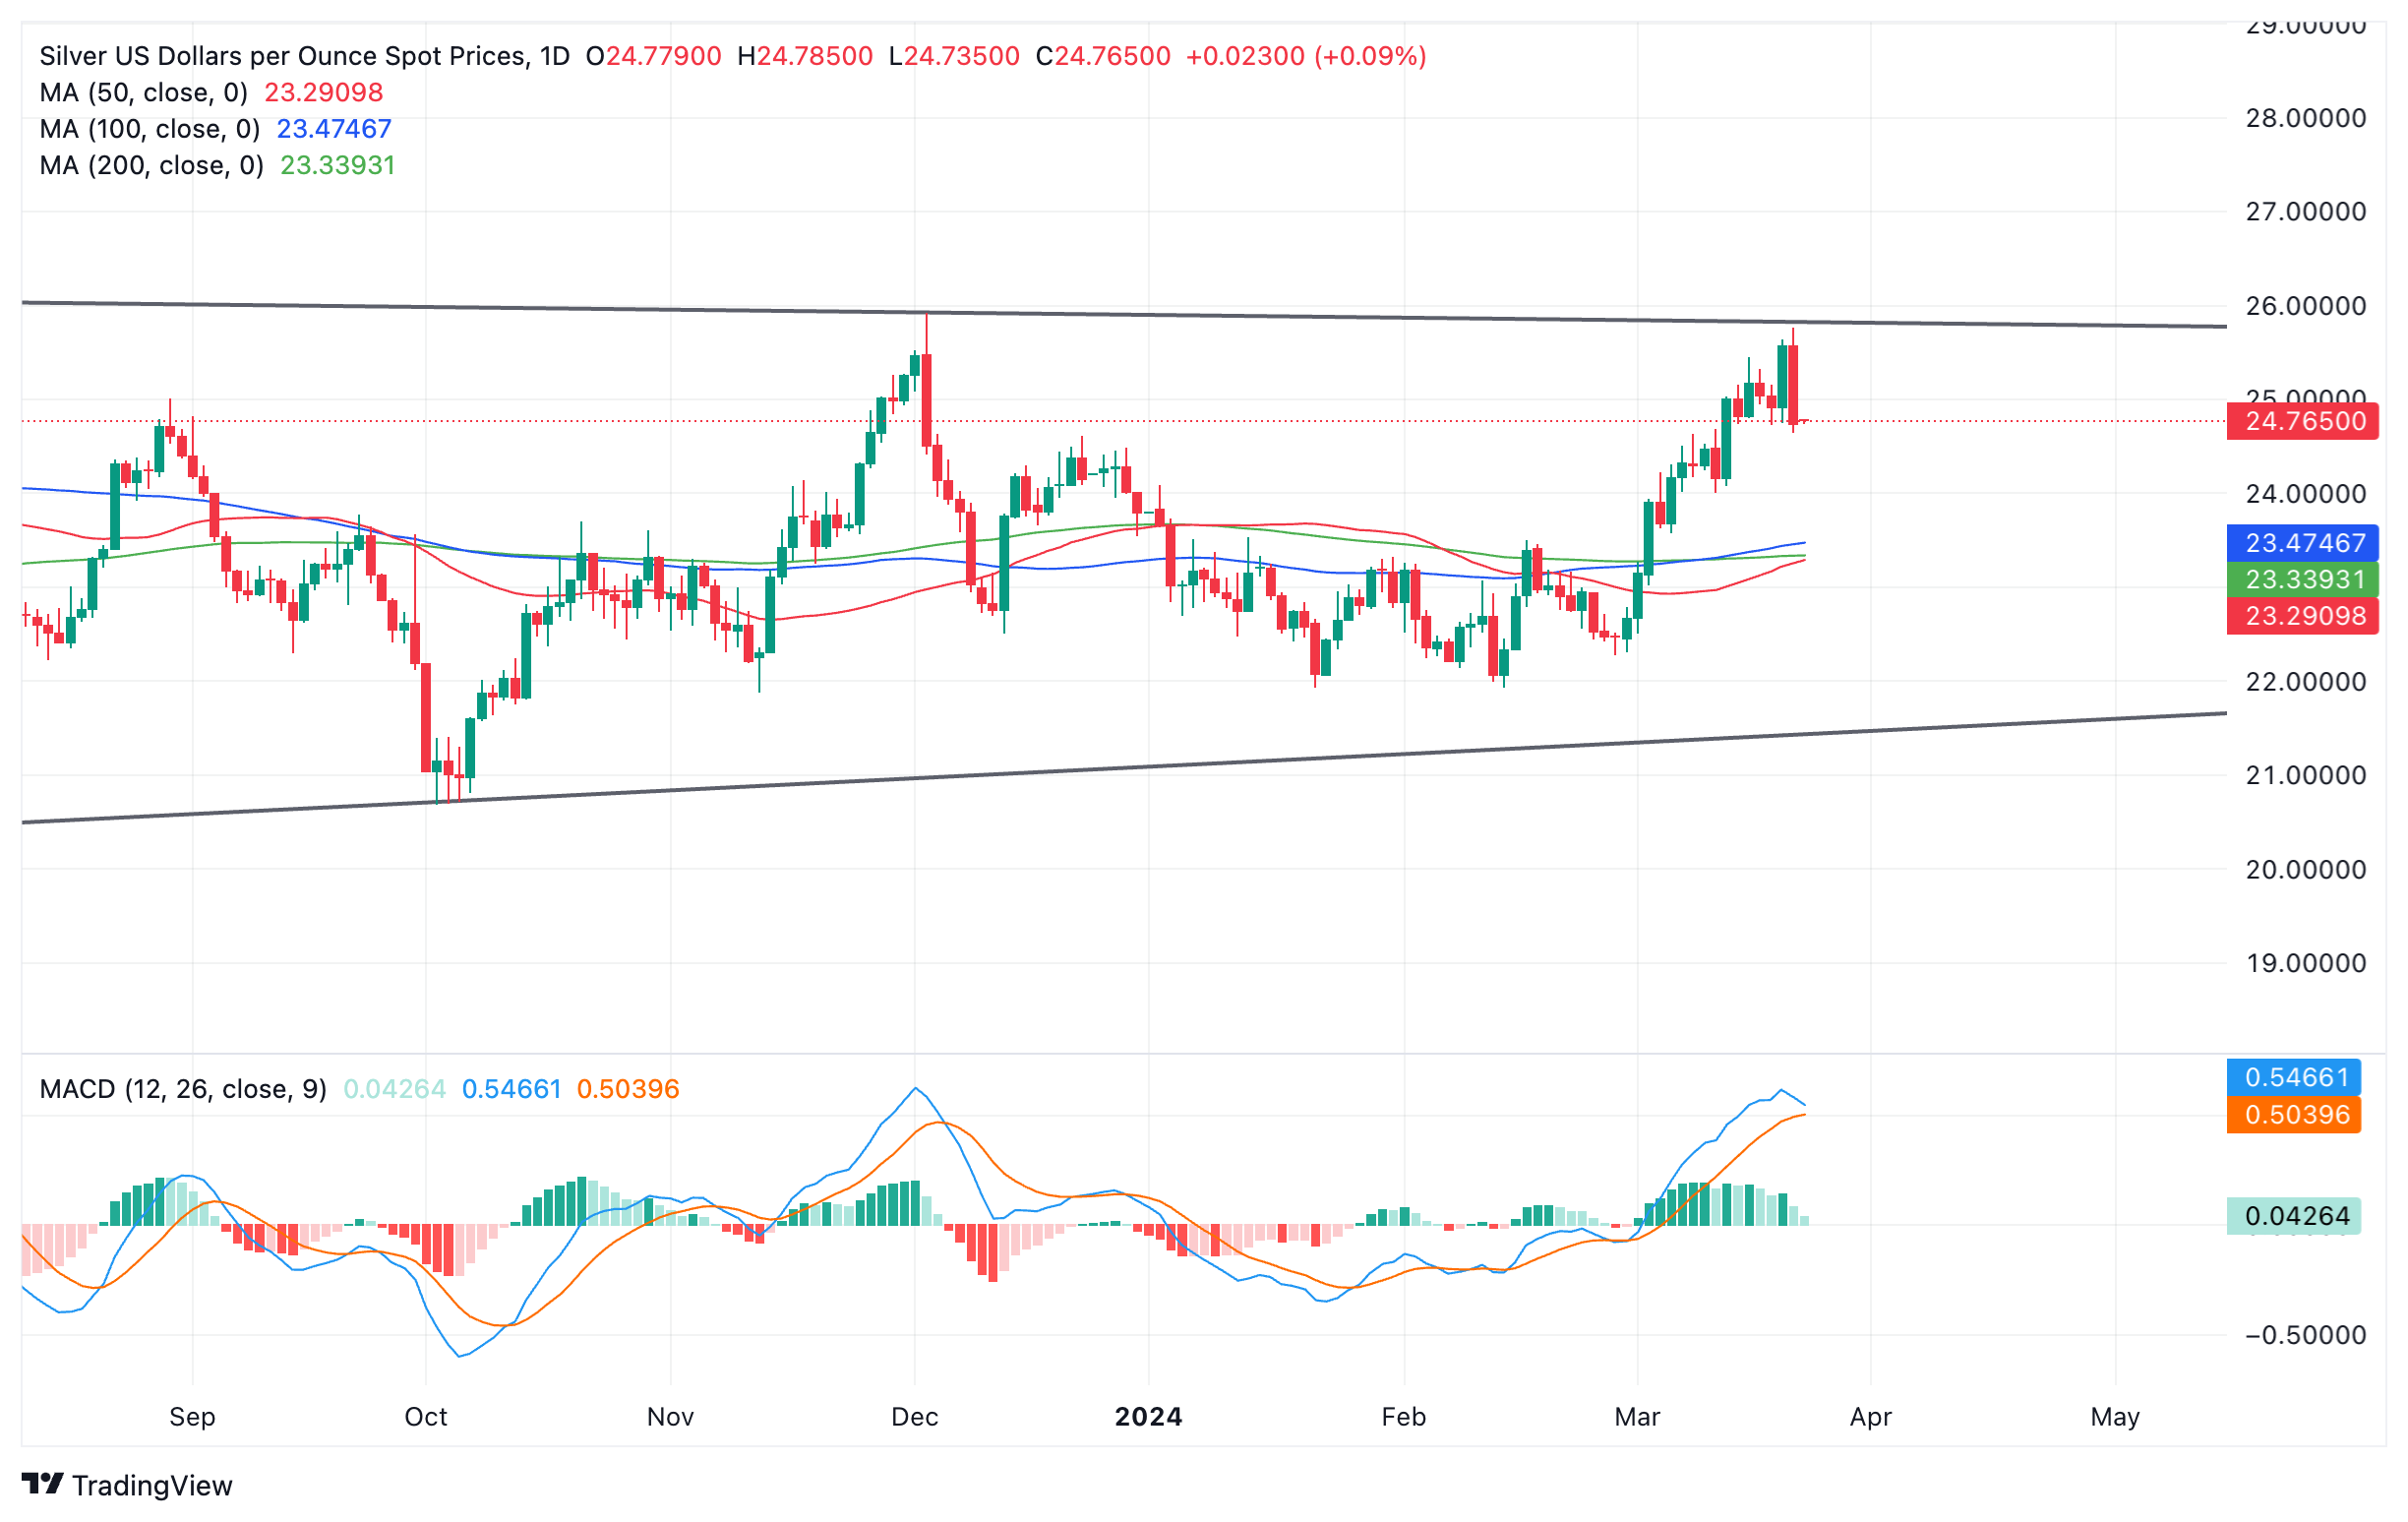
Silver price (XAG/USD) is trading in the $24.750s on Friday, after touching the top of a multi-month range at roughly $25.700 and reversing lower.
Silver formed a Bearish Engulfing Japanese candlestick pattern on the daily chart on Thursday, which reinforces the reversal and suggests more downside in the short-term.
Silver versus US Dollar: Daily chart
The Moving Average Convergence/ Divergence (MACD) momentum indicator is threatening to cross below its signal line, adding credence to the bearish reversal. The MACD is a particularly reliable indicator within range-bound markets and a cross would provide a good sell signal.
If the pair breaks below 24.405 it will probably continue south to a potential target at the cluster of major moving averages, in the lower 23.000s, starting with the 100-day Simple Moving Average (SMA) at 23.475.
A break back above the 25.770 highs of Thursday, however, would indicate a probable extension of the uptrend.
A decisive break above the range highs would indicate even more bullish momentum higher. Such a move would be expected to then reach a conservative target at the 0.618 extrapolation of the height of the range from the breakout point higher, and a target at 28.524.
