
Dow Jones Industrial Average dives after string US inflation figures
- Wall Street indexes plunge as US inflation dampens hopes of Fed rate cuts in June.
- All sectors are trading lower with Real Estate and Utilities the most affected.
- The Dow Jones Index is under increasing bearish pressure below 38,540 with scope to retest 38,035 area.
Equity markets are taking a blow on Wednesday as an unexpectedly strong US inflation report has hammered hopes that the Federal Reserve (Fed) may start lowering borrowing costs in the near term.
US Consumer Prices Index (CPI) accelerated at a 0.4% pace in March, against expectations of a slowdown to 0.3%, while the yearly rate increased to 3.5% from 3.2% in the previous month. These numbers confirm that price pressures remain stubbornly high and ditch the market’s roadmap of three rate cuts in 2024, starting in June.
The risk-averse reaction to CPI data has sent the main US indices tumbling. The Dow Jones leads losses, down 1.27% to 38,383, increasing its distance from March highs near 40,000. The S&P 500 and the NASDAQ index drop 1.13% each to 5,150 and 16,117, respectively.
Dow Jones news
All Wall Street sectors are posting losses on Wednesday. Real Estate is the most affected by higher-for-longer interest rates and falls 4.24%, followed by Utilities, down 2.05%, and Materials, which gives away 1.6%. The least- affected sectors are Energy, only 0.5% lower, and Communication Services with a 0.65% decline.
Home Depot (HD) is leading losses with a 2.88% drop to $351.05, followed by Boeing (BA), 2.75% lower to $173.29, and Intel (INTL), which is losing 2.65% to $38.31. Only Walmart (WMT) is in the green on Wednesday with a 0.7% advance to $60.20.
Dow Jones technical outlook
The Dow Jones index is on track to print a strong bearish candle on the daily chart, confirming the negative trend from the March top, right below 40,000.
The strong reaction to the US inflation data has pushed the Index below the 38,540 support level, with the bearish cross between the 4-hour 50 and 100 Simple Moving Averages (SMAs) giving hope to bears. Below here, the next target is 38,033.
The previous support at the mentioned 38,540 is likely to offer some resistance, and above there, an order block, right below 39,000, will challenge a potential bullish attempt.
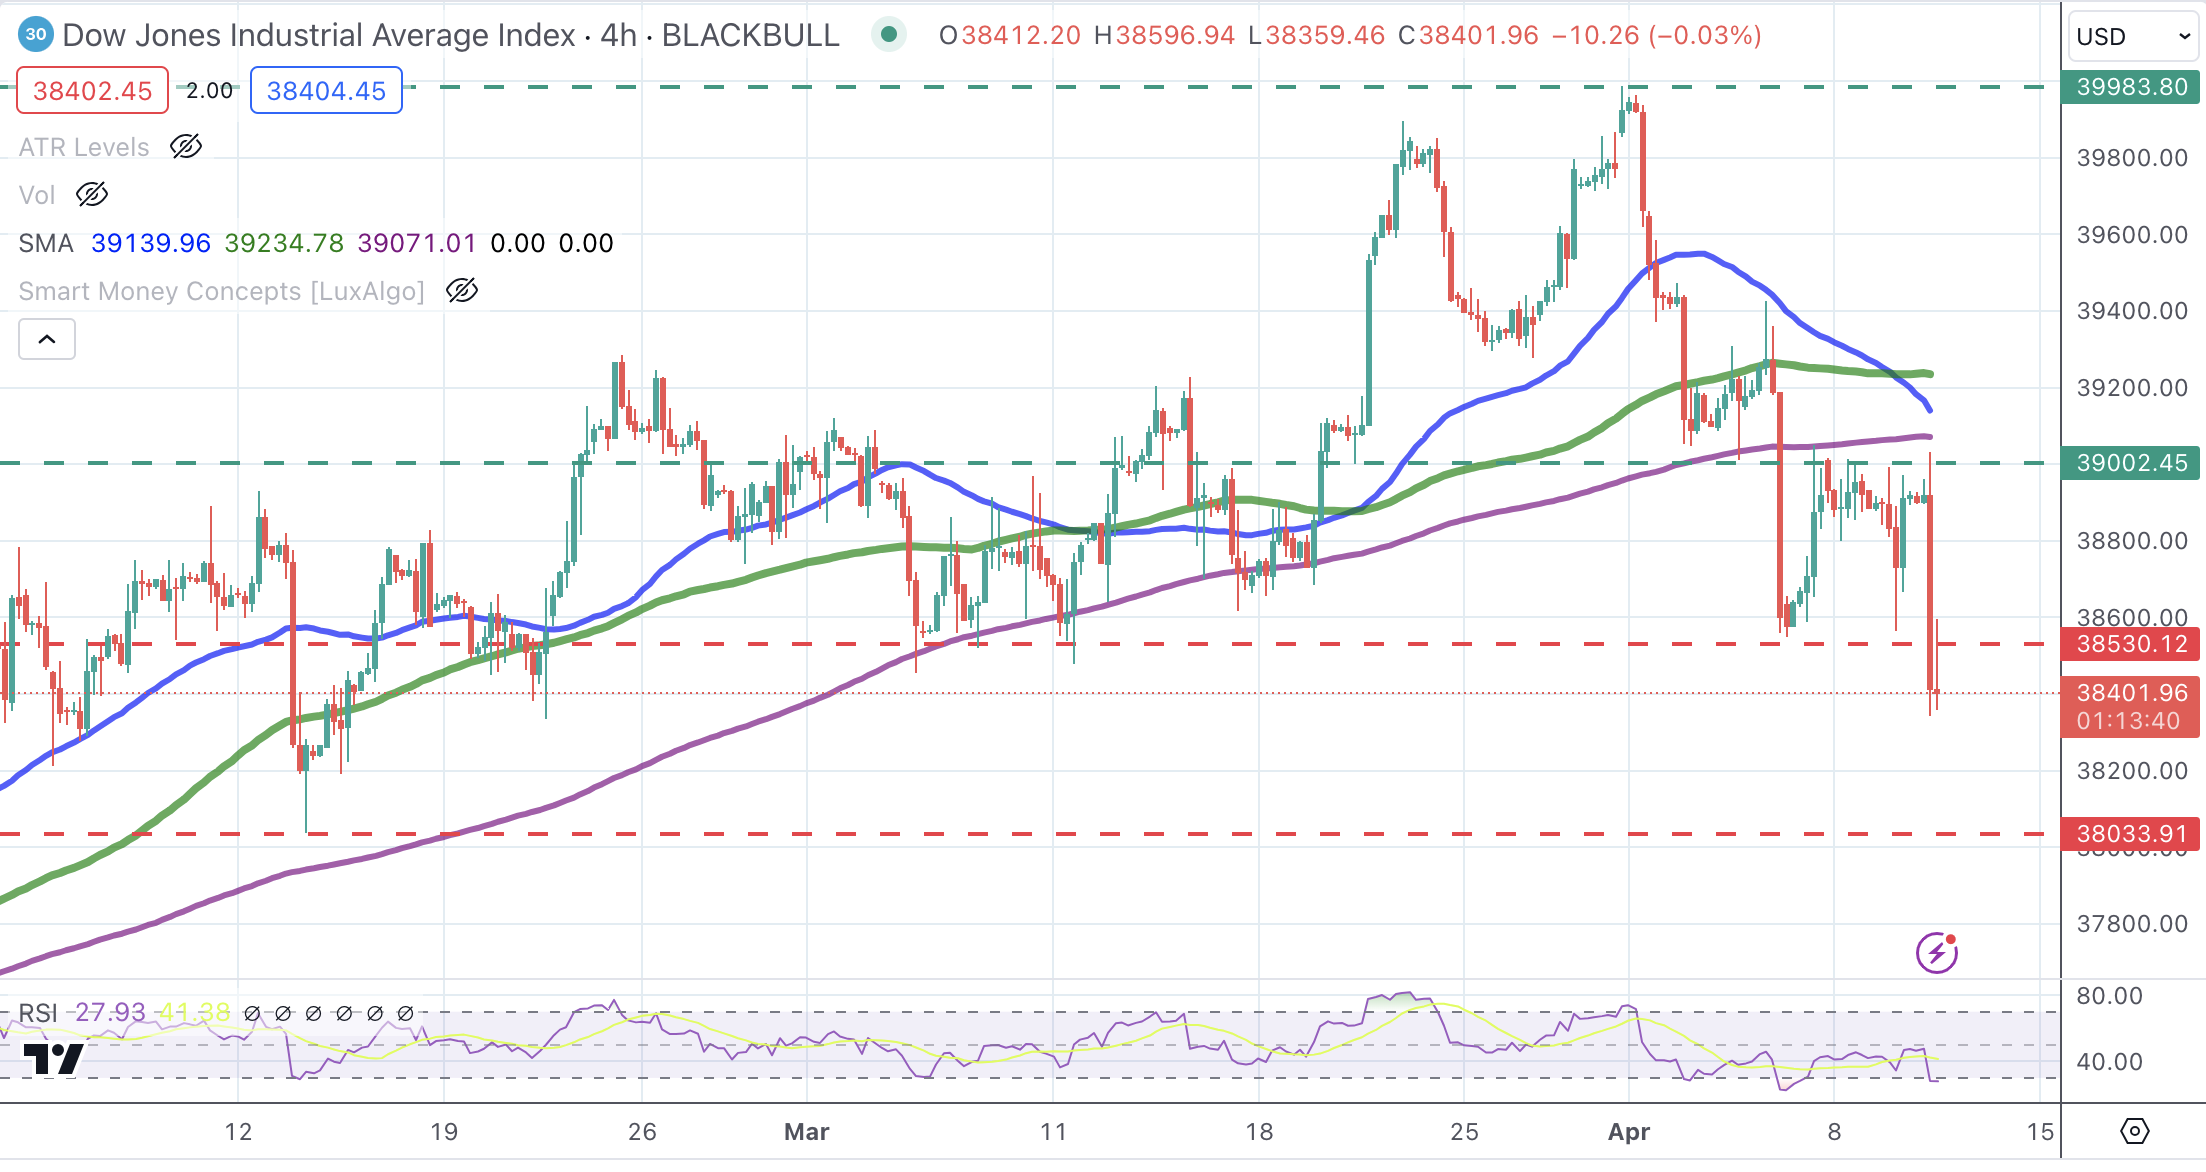
Dow Jones Index 4-Hour Chart
Dot Plot FAQs
The “Dot Plot” is the popular name of the interest-rate projections by the Federal Open Market Committee (FOMC) of the US Federal Reserve (Fed), which implements monetary policy. These are published in the Summary of Economic Projections, a report in which FOMC members also release their individual projections on economic growth, the unemployment rate and inflation for the current year and the next few ones. The document consists of a chart plotting interest-rate projections, with each FOMC member’s forecast represented by a dot. The Fed also adds a table summarizing the range of forecasts and the median for each indicator. This makes it easier for market participants to see how policymakers expect the US economy to perform in the near, medium and long term.
The US Federal Reserve publishes the “Dot Plot” once every other meeting, or in four of the eight yearly scheduled meetings. The Summary of Economic Projections report is published along with the monetary policy decision.
The “Dot Plot” gives a comprehensive insight into the expectations from Federal Reserve (Fed) policymakers. As projections reflect each official’s projection for interest rates at the end of each year, it is considered a key forward-looking indicator. By looking at the “Dot Plot” and comparing the data to current interest-rate levels, market participants can see where policymakers expect rates to head to and the overall direction of monetary policy. As projections are released quarterly, the “Dot Plot” is widely used as a guide to figure out the terminal rate and the possible timing of a policy pivot.
The most market-moving data in the “Dot Plot” is the projection of the federal funds rate. Any change compared with previous projections is likely to influence the US Dollar (USD) valuation. Generally, if the “Dot Plot” shows that policymakers expect higher interest rates in the near term, this tends to be bullish for USD. Likewise, if projections point to lower rates ahead, the USD is likely to weaken.