
The TJX Companies Inc.(TJX) Elliott Wave technical analysis [Video]
TJX Elliott Wave Analysis Trading Lounge Daily Chart,
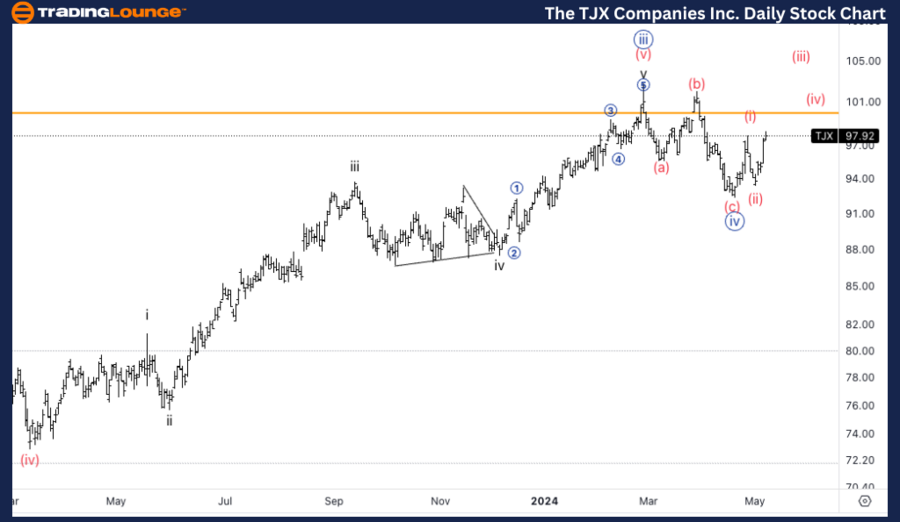
The TJX Companies Inc., (TJX) Daily Chart
TJX Elliott Wave technical analysis
Function: Trend.
Mode: Impulsive.
Structure: Motive.
Position: Minute wave {v}.
Direction: Upside in Minute {v}.
Details: Looking for a bottom in wave {iv} in place to then continue higher. Equality of {v} vs. {i} stands at 108$.
Our detailed Elliott Wave analysis for The TJX Companies Inc. (TJX) as of May 7, 2024, offers insightful perspectives on potential movements for both daily and 4-hour trading charts. This analysis aims to assist traders and investors in identifying strategic positions in line with the predicted trends in TJX’s stock prices.
TJX Elliott Wave Technical Analysis – Daily chart
On the daily chart, TJX is currently exhibiting an impulsive, motive wave pattern, specifically within Minute wave {v}. This wave is crucial as it suggests a continued upward momentum following the establishment of a bottom in wave {iv}. The target for equality between wave {v} and wave {i} is projected at $108, indicating significant upside potential.
TJX Elliott Wave Analysis Trading Lounge 4Hr Chart
The TJX Companies Inc., (TJX) 4Hr Chart
TJX Elliott Wave technical analysis
Function: Trend.
Mode: Impulsive.
Structure: Motive.
Position: Wave (i) of {v}.
Direction: Upside in wave (iii).
Details: Looking for a CTLP on 100$, we need to break (b) to then start thinking about longs.
TJX Elliott Wave technical analysis – Four hour chart
Zooming into the 4-hour chart, TJX is progressing through Wave (i) of Minute {v}. The focus is on the upcoming wave (iii), which is known for its typically strong upward drive. A critical price point to monitor is the $100 level, where a conclusive break above the (b) wave high will validate bullish sentiments and open the door for positioning long trades.
Technical analyst: Alessio Barretta.
