Canadian Dollar struggles to hold ground against Greenback on Tuesday

- Canadian Dollar holds onto slim gains against softer USD.
- Canada remains data-light this week, US inflation data takes center stage.
- US PPI inflation rises on Tuesday, US CPI inflation due Wednesday.
The Canadian Dollar (CAD) is mixed on Tuesday after broader markets focused on the latest round of inflation figures from the US as investors continue to look for signs of rate cuts from the Federal Reserve (Fed). The CAD held onto recent gains against the Greenback but remains mired in technical consolidation.
Canada saw a slightly better-than-expected decline in MoM Wholesale Sales in March, but strictly low-tier data from Canada this week leaves investors overwhelmingly focused on US inflation data. US Producer Price Index (PPI) inflation for April came in higher than expected MoM. Annualized producer-level inflation arrived as expected but was still higher than before as price growth continues to grip the US economy.
Daily digest market movers: Canadian Dollar holds onto the midrange as inflation dominates
- Canadian Wholesales Sales in March fell -1.1%, less than the expected -1.3% decline but still down from the previous month’s 0.2% (revised from 0.0%). Market impact was muted on the low-tier data release.
- US PPI inflation rose again in April, with MoM PPI growing 0.5% compared to the 0.3% forecast and rebounding from the previous month’s -0.1% decline.
- Core PPI for the year ended in April came in as expected at 2.4%, but still rose from the previous period’s 2.1% (revised from 2.4%).
- US Consumer Price Index (CPI) inflation figures are due on Wednesday, and markets are hoping for an easing in consumer-level inflation. YoY CPI is forecast to tick down to 0.3% from 0.4%, and Core CPI is expected to ease slightly to 3.6% from 3.8%.
- Fed Chair Jerome Powell noted in an appearance on Tuesday that “inflation in Q1 was notable for the lack of further progress.”
- Fed Chair Jerome Powell: Producer Price Index reading was quite mixed
Canadian Dollar PRICE Today
The table below shows the percentage change of Canadian Dollar (CAD) against listed major currencies today. Canadian Dollar was the strongest against the Japanese Yen.
| USD | EUR | GBP | JPY | CAD | AUD | NZD | CHF | |
|---|---|---|---|---|---|---|---|---|
| USD | -0.26% | -0.22% | 0.17% | -0.08% | -0.20% | -0.28% | -0.17% | |
| EUR | 0.26% | 0.02% | 0.44% | 0.19% | 0.07% | -0.02% | 0.08% | |
| GBP | 0.22% | -0.02% | 0.39% | 0.12% | 0.02% | -0.05% | 0.05% | |
| JPY | -0.17% | -0.44% | -0.39% | -0.24% | -0.38% | -0.46% | -0.33% | |
| CAD | 0.08% | -0.19% | -0.12% | 0.24% | -0.14% | -0.19% | -0.10% | |
| AUD | 0.20% | -0.07% | -0.02% | 0.38% | 0.14% | -0.08% | 0.03% | |
| NZD | 0.28% | 0.02% | 0.05% | 0.46% | 0.19% | 0.08% | 0.11% | |
| CHF | 0.17% | -0.08% | -0.05% | 0.33% | 0.10% | -0.03% | -0.11% |
The heat map shows percentage changes of major currencies against each other. The base currency is picked from the left column, while the quote currency is picked from the top row. For example, if you pick the Canadian Dollar from the left column and move along the horizontal line to the US Dollar, the percentage change displayed in the box will represent CAD (base)/USD (quote).
Technical analysis: Canadian Dollar grips near-term gains, but bullish stance weakens
The Canadian Dollar (CAD) is broadly mixed on Tuesday, gaining further ground against the Japanese Yen (JPY) and holding steady against the US Dollar (USD). However, the CAD shed thin weight against the Euro (EUR) and Pound Sterling (GBP).
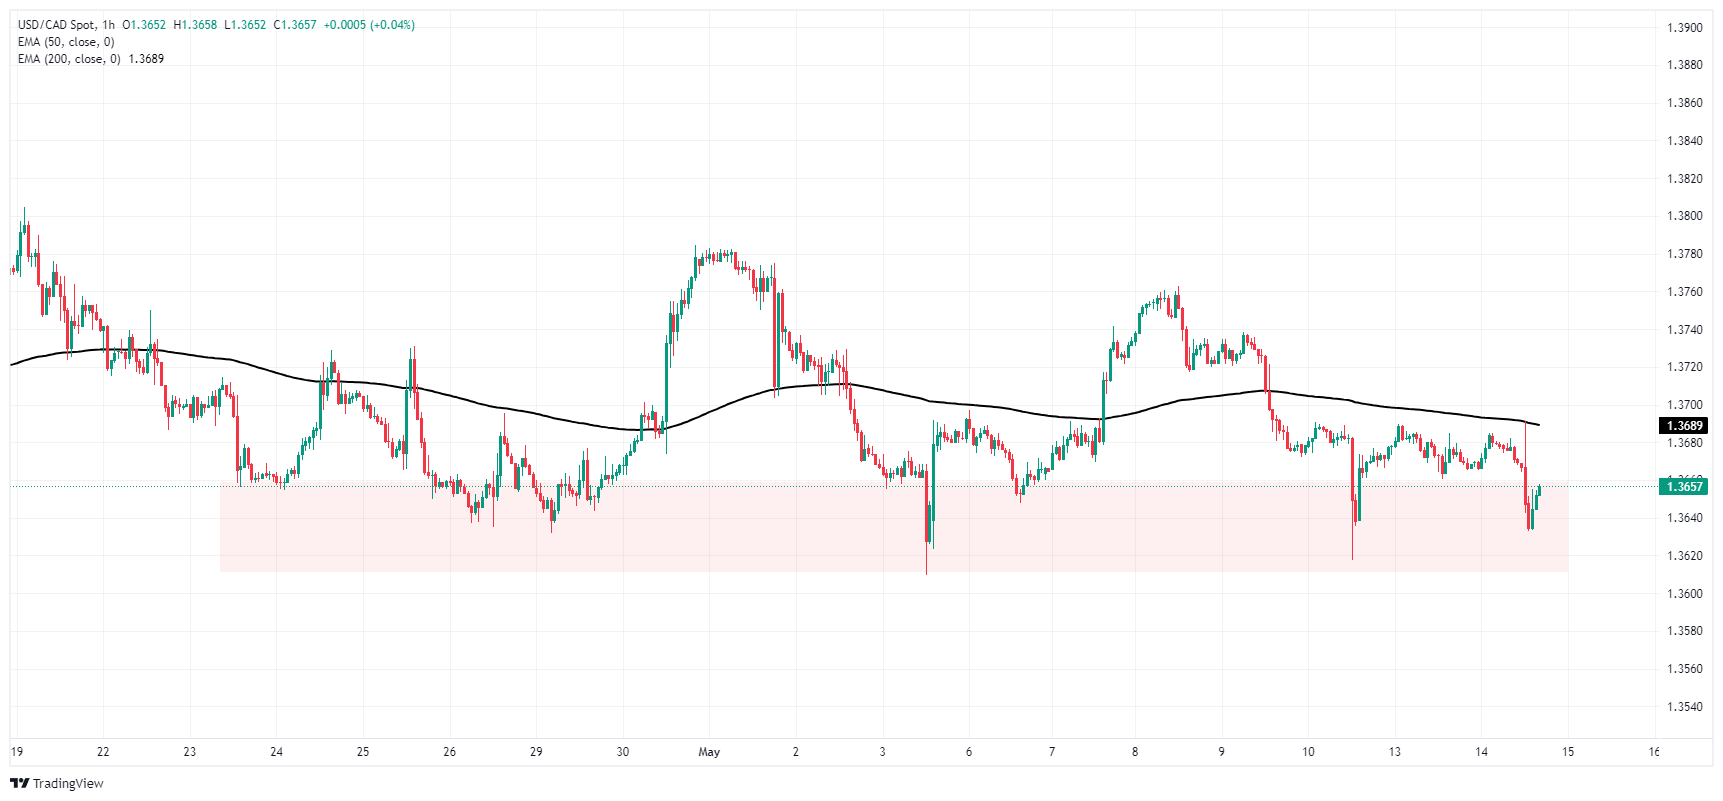
USD/CAD slid back into a familiar demand zone below 1.3660, but the pair is treading water in the near term. Bids continue to cycle near the 200-hour Exponential Moving Average (EMA) at 1.3691.
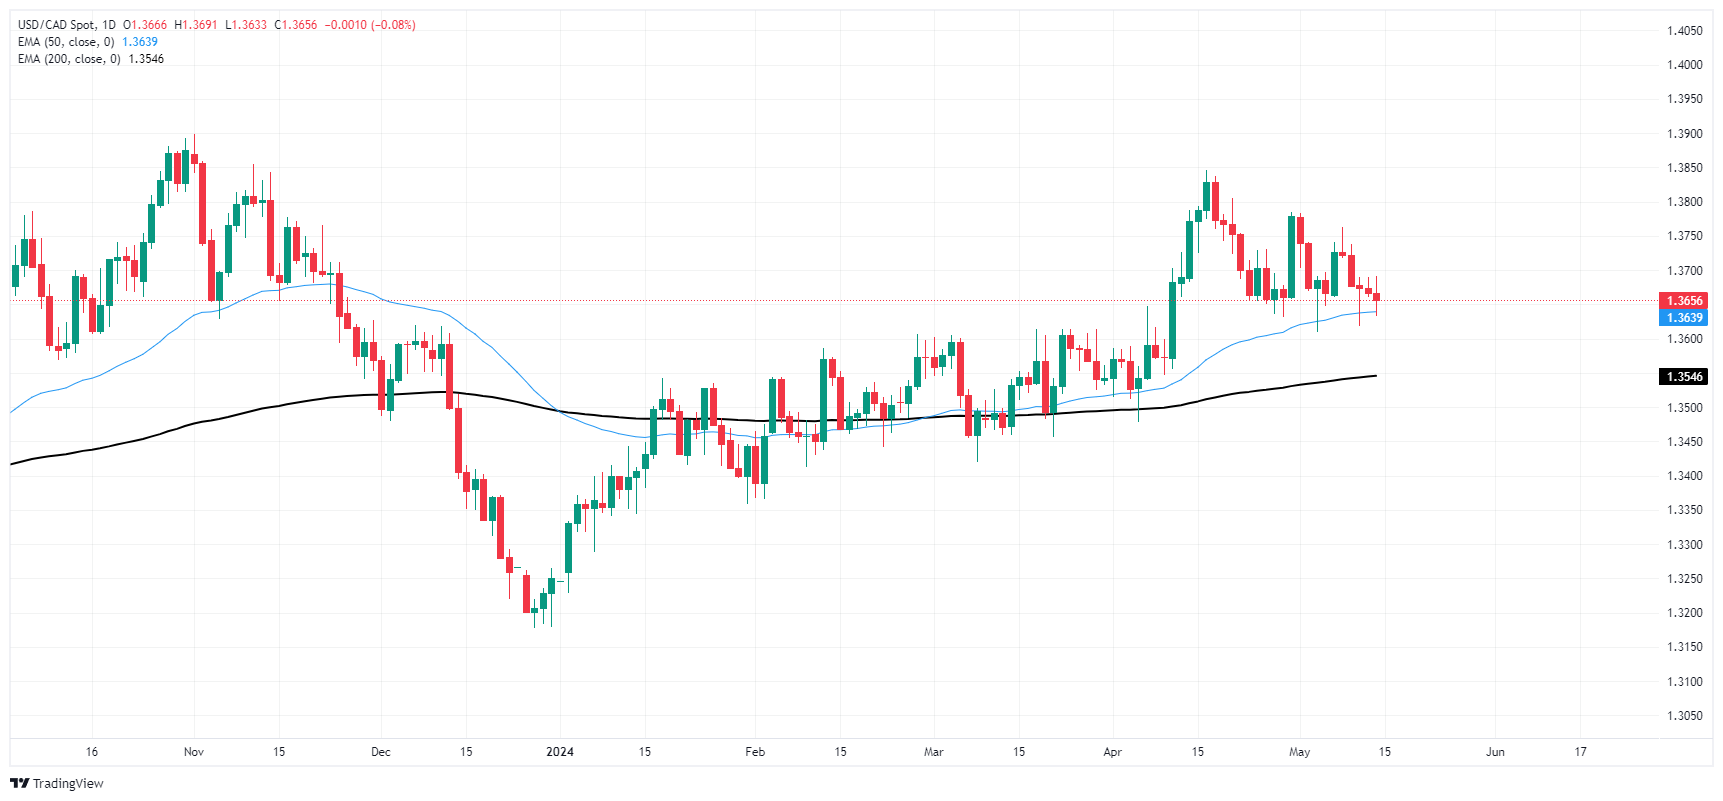
Technical support is baked into daily candles at the 50-day EMA near 1.3640, and USD/CAD is still trading north of the 200-day EMA at 1.3546 despite trading on the low side of the last swing high near 1.3850. The pair is up over 3% for 2024.
USD/CAD hourly chart
USD/CAD daily chart
Economic Indicator
Consumer Price Index (MoM)
Inflationary or deflationary tendencies are measured by periodically summing the prices of a basket of representative goods and services and presenting the data as The Consumer Price Index (CPI). CPI data is compiled on a monthly basis and released by the US Department of Labor Statistics. The MoM figure compares the prices of goods in the reference month to the previous month.The CPI is a key indicator to measure inflation and changes in purchasing trends. Generally, a high reading is seen as bullish for the US Dollar (USD), while a low reading is seen as bearish.
