Deere & Co.(DE) Elliott Wave technical analysis [Video]

Function: Trend.
Mode: Impulsive.
Structure: Motive.
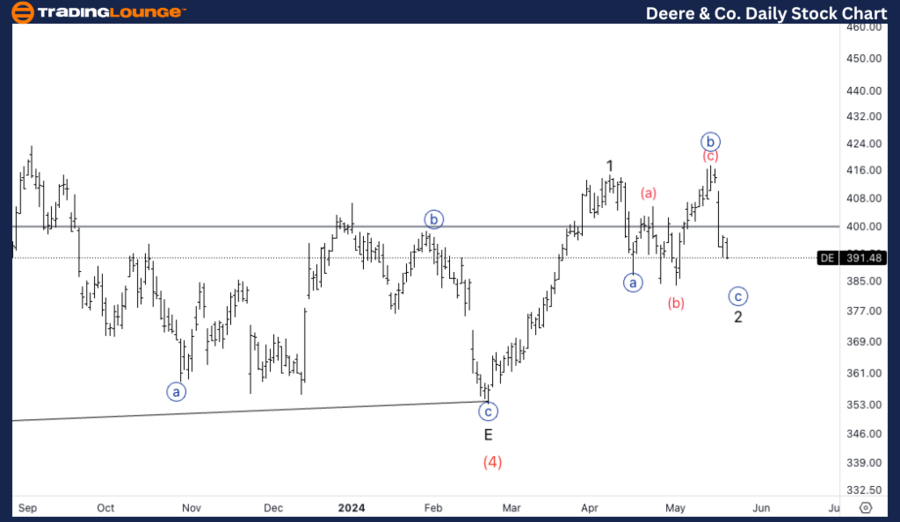
Position: Minor 2 of (1).
Direction: Bottoming in wave 2.
Details: Looking for a three wave move in wave 2 to be soon completed, to then continue higher.
DE Elliott Wave technical analysis – Daily chart
In our latest Elliott Wave analysis of Deere & Co. (DE), we observe a bullish trend with an impulsive structure. Currently positioned at Minor wave 2 of (1), DE is bottoming in wave 2. We anticipate the three-wave move in wave 2 to soon complete, setting the stage for a continuation to the upside. Traders should watch for signs of this bottoming to prepare for potential long positions as the trend resumes.
DE Elliott Wave technical analysis
Function: Counter Trend.
Mode: Corrective.
Structure: Flat.
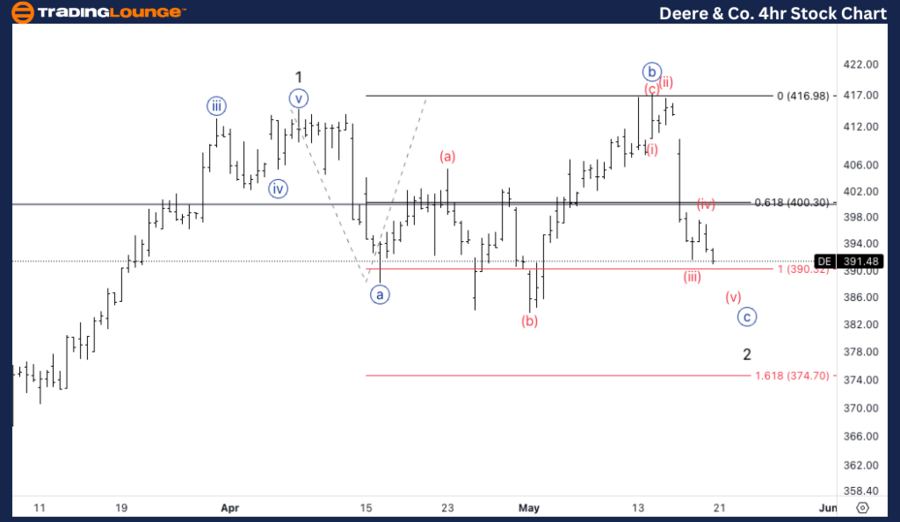
Position: Wave {c} of C.
Direction: Wave (v) of {c}.
Details: Looking for equality of {c} vs. {a} at 390$, looking for a Classic Trading Level Pattern around 400$ to then enter long positions.
DE Elliott Wave technical analysis – Four-hour chart
On the 4-hour chart, DE is exhibiting a corrective mode within a flat structure, specifically positioned in wave {c} of C. We are looking for wave (v) of {c} to reach equality with wave {a} at the $390 level. Additionally, we expect a Classic Trading Level Pattern to emerge around the $400 mark. This pattern will provide an opportunity to enter long positions as DE completes its corrective phase and resumes its upward movement.
Welcome to our latest Elliott Wave analysis for Deere & Co. (DE), In this report, we provide a detailed examination of DE’s price movements and future projections using the Elliott Wave Theory. This analysis will cover both the daily and 4-hour charts, offering insights into the current trends and potential trading opportunities. Whether you are a seasoned trader or a market enthusiast, this analysis aims to enhance your understanding of DE’s market behavior.

