
V300AEQ ETF Units Elliott Wave technical forecast [Video]
ASX: V300AEQ ETF UNITS – VAS Elliott Elliott Wave Technical Analysis TradingLounge (1D Chart)
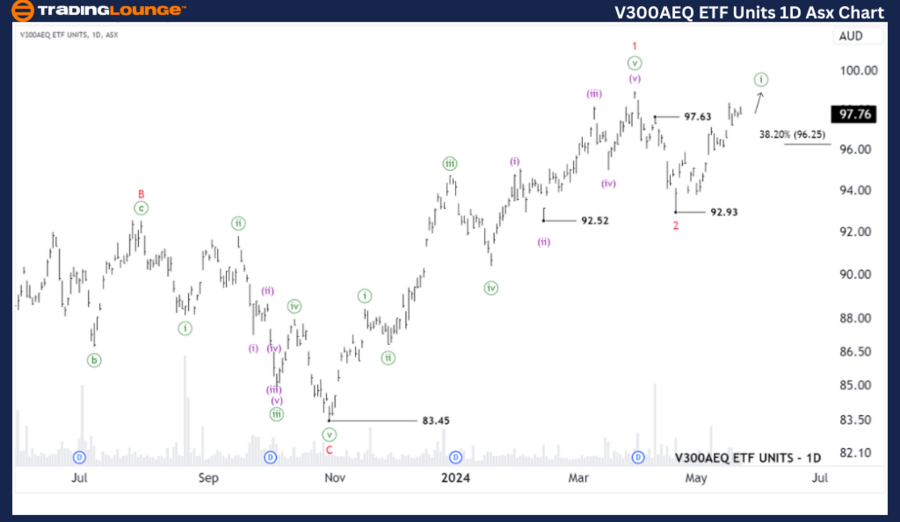
Greetings, Our Elliott Wave analysis today updates the Australian Stock Exchange (ASX) with V300AEQ ETF UNITS – VAS. We confirmed that wave 2-red has ended and wave 3-red is opening to push higher.
ASX: V300AEQ ETF Units – VAS Elliott Wave technical analysis
Function: Major trend (Minor degree, red).
Mode: Motive.
Structure: Impulse.
Position: Wave ((i))-green of Wave 3-red.
Details: The short-term outlook suggests that wave ((i))-green is unfolding and continues to push higher, while the price must maintain above 96.25. A drop below this level would indicate that wave ((ii))-green is unfolding.
Invalidation point: 83.45.
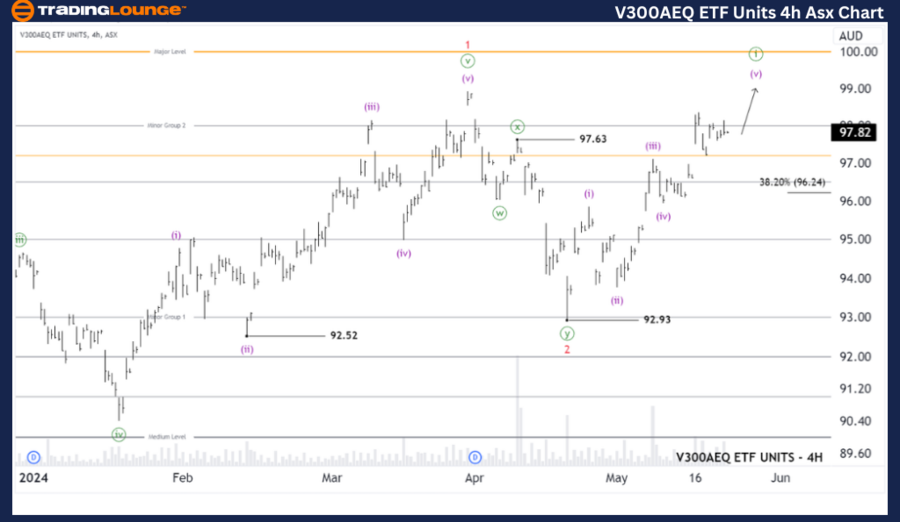
ASX: V300AEQ ETF Units – VAS four-hour chart analysis
Function: Major trend (Minute degree, green).
Mode: Motive.
Structure: Impulse.
Position: Wave (v)-purple of Wave ((iii))-green.
Details: The even shorter-term outlook suggests that wave 3-red is unfolding, and wave (v)-purple appears to be nearing completion, coinciding with the completion of wave ((i))-green. Essentially, the trend will likely continue to push higher, while the price must remain above 96.24. A drop below this level indicates that wave ((ii))-green is unfolding to push lower, followed by wave ((iii))-green ready to push higher again.
Invalidation point: 92.93.
Conclusion
Our analysis, forecast of contextual trends, and short-term outlook for ASX: V300AEQ ETF UNITS – VAS aim to provide readers with insights into the current market trends and how to capitalize on them effectively. We offer specific price points that act as validation or invalidation signals for our wave count, enhancing the confidence in our perspective. By combining these factors, we strive to offer readers the most objective and professional perspective on market trends.