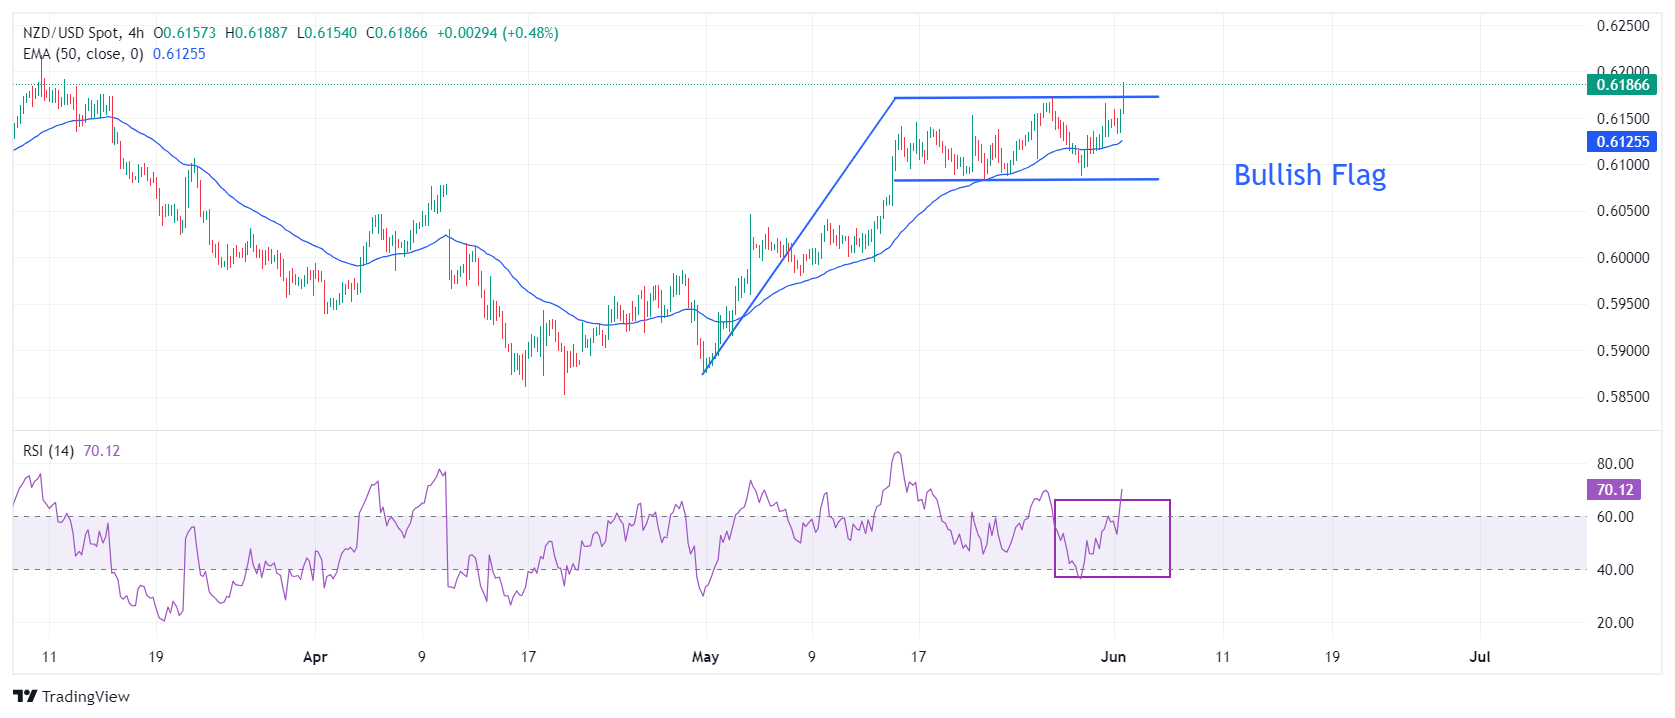
NZD/USD Price Analysis: Attempts Bullish Flag breakout

- NZD/USD jumps to 0.6815 after downbeat US ISM Manufacturing PMI report.
- Weak factory activity report dents the US Dollar’s appeal.
- The RBNZ is less likely to return to the policy normalization process this year.
The NZD/USD pair advances to 0.6185 in Monday’s American session as the United States (US) Institute of Supply Management (ISM) has reported a weak Manufacturing PMI report for May. The agency reported that the Manufacturing PMI, which gauges the factory activity, surprisingly declines to 48.7 from the estimates of 49.8 and the former release of 49.2.
Apart from that, other sub-components such as New Orders and Prices Paid Indexes were also weaker than expectations, weighing on the US Dollar (USD). Weak factory data is expected to boost market speculation for the Federal Reserve (Fed) to begin reducing interest rates from the September meeting. The US Dollar Index (DXY) slumps to 104.25.
Meanwhile, the New Zealand Dollar remains firm as investors expect that the Reserve Bank of New Zealand (RBNZ) will not consider lowering interest rates this year. Also, there is a debate that the RBNZ could hike its Official Cash Rate further. Meanwhile, RBNZ Governor Adrian Orr has already commented that more rate hikes remain off the table as long as inflation expectations remain anchored.
NZD/USD attempts to break the Bullish Flag chart formation in a four-hour timeframe, which exhibits an inventory adjustment process between institutional investors and retail participants. This pattern indicates a consolidation after a sharp upside move and it generally breaks towards the direction of the trend, which in this is upwards.
The 50-period Exponential Moving Average (EMA) near 0.6126 continues to provide support to the New Zealand Dollar bulls.
Meanwhile, the 14-period Relative Strength Index (RSI) has climbed above 60.00. A sustainable move above 60.00 will strengthen Kiwi bulls further.
An upside move above the round-level resistance of 0.6200 will drive the asset January 15 high near 0.6250, followed by January 12 high near 0.6280.
On the contrary, fresh downside would appear if the asset breaks below April 4 high around 0.6050 This would drag the asset towards the psychological support of 0.6000 and April 25 high at 0.5969.
