
Natural Gas set for weekly gains even as Norwegian flows resume
- Natural Gas price trades above $2.85 and is set to close the week in green.
- Egypt has issued a bigger than expected tender for more than 15 LNG cargoes.
- The US Dollar Index flirts with a break below 104.00 ahead of the US Employment Report for May.
Natural Gas price (XNG/USD) trades marginally higher above $2.85 on Friday, extending this week’s positive move, with markets ignoring that the Norwegian Gas is flowing again in full volume towards Europe and the UK. Instead, traders are more focused on the surprise tender from Egypt, which exceeded expectations. Initially, the assumption was that Egypt would only issue a tender for less than 10 Liquefied Natural Gas (LNG) cargoes, though the final data on Thursday showed the tender for more than 15 LNG cargoes, according to Reuters.
Meanwhile, the US Dollar Index (DXY), which tracks the Greenback’s value against six major currencies, hovers around 104.00 ahead of the US Employment Report for May, with the Nonfarm Payrolls (NFP) number, Unemployment Rate and the Average Hourly Earnings for the month. Volatility is set to pick up, should the Nonfarm Payrolls number miss expectations, with consensus views titled to a higher number than the previous month. In case of a big miss in the US employment data and a sell-off in the DXY, the Natural Gas price could extend its positive move on Friday.
Natural Gas is trading at $2.87 per MMBtu at the time of writing.
Natural Gas news and market movers: Egypt is buying up
- Reuters reported on Friday that Egypt has released tender details for at least 15 LNG cargoes with deliveries to cover summer demand.
- Taiwan has signed a three-decade-long agreement with Qatar to buy LNG to fill the gap for its missing Nuclear and Coal energy, which is being phased out.
- Bloomberg reports that Gazprom CEO Alexey Miller and Turkey’s Energy Minister Alparslan Bayraktar have discussed further plans for an international Gas hub during a meeting in St. Petersburg.
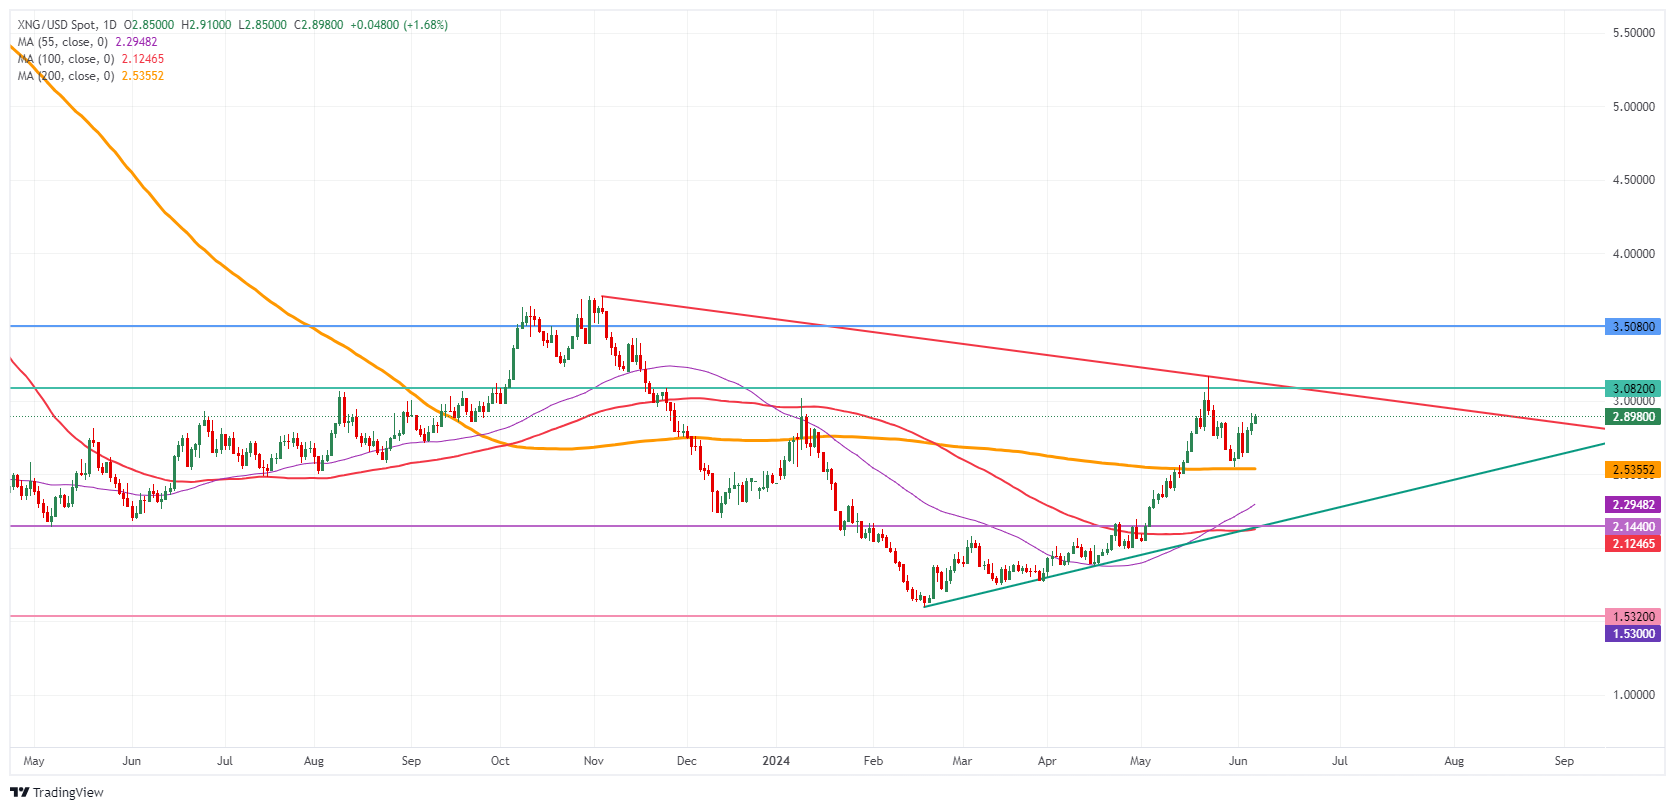
Natural Gas Technical Analysis: A bounce that keeps going
Natural Gas trades higher again after a perfect technical bounce earlier this week against the 200-day Simple Moving Average (SMA) at $2.53. From here on out, the question is whether that bounce is strong enough to head to $3.08 on the upside. Meanwhile, the CME FedWatch Tool suggests a 68% chance that the Federal Reserve’s (Fed) interest rate will be lower than the current level in September, which might boost Gas prices in the idea that an interest rate cut would be good for demand.
On the upside, the $3.00 marker as a big figure was tested in May and remains a first element to watch out for on the upside. The pivotal level near $3.07 ( March 6, 2023, high) remains key as prices failed to post a daily close above it. Further up, the fresh year-to-date high at $3.16 is the level to beat.
On the downside, the 200-day Simple Moving Average (SMA) acts as the first support near $2.53. Should that support area fail to hold, the next target could be the pivotal level near $2.14, with interim support by the 55-day SMA near $2.25. Further down, the biggest support comes at $2.11 with the 100-day SMA.
Natural Gas: Daily Chart
Natural Gas FAQs
Supply and demand dynamics are a key factor influencing Natural Gas prices, and are themselves influenced by global economic growth, industrial activity, population growth, production levels, and inventories. The weather impacts Natural Gas prices because more Gas is used during cold winters and hot summers for heating and cooling. Competition from other energy sources impacts prices as consumers may switch to cheaper sources. Geopolitical events are factors as exemplified by the war in Ukraine. Government policies relating to extraction, transportation, and environmental issues also impact prices.
The main economic release influencing Natural Gas prices is the weekly inventory bulletin from the Energy Information Administration (EIA), a US government agency that produces US gas market data. The EIA Gas bulletin usually comes out on Thursday at 14:30 GMT, a day after the EIA publishes its weekly Oil bulletin. Economic data from large consumers of Natural Gas can impact supply and demand, the largest of which include China, Germany and Japan. Natural Gas is primarily priced and traded in US Dollars, thus economic releases impacting the US Dollar are also factors.
The US Dollar is the world’s reserve currency and most commodities, including Natural Gas are priced and traded on international markets in US Dollars. As such, the value of the US Dollar is a factor in the price of Natural Gas, because if the Dollar strengthens it means less Dollars are required to buy the same volume of Gas (the price falls), and vice versa if USD strengthens.