
USD/CAD Price Analysis: Threatening to break out of triangle price pattern
- USD/CAD is attempting to break out of a triangle price pattern and push higher.
- A decisive breakout would reaffirm 2024’s uptrend and begin a new more bullish phase.
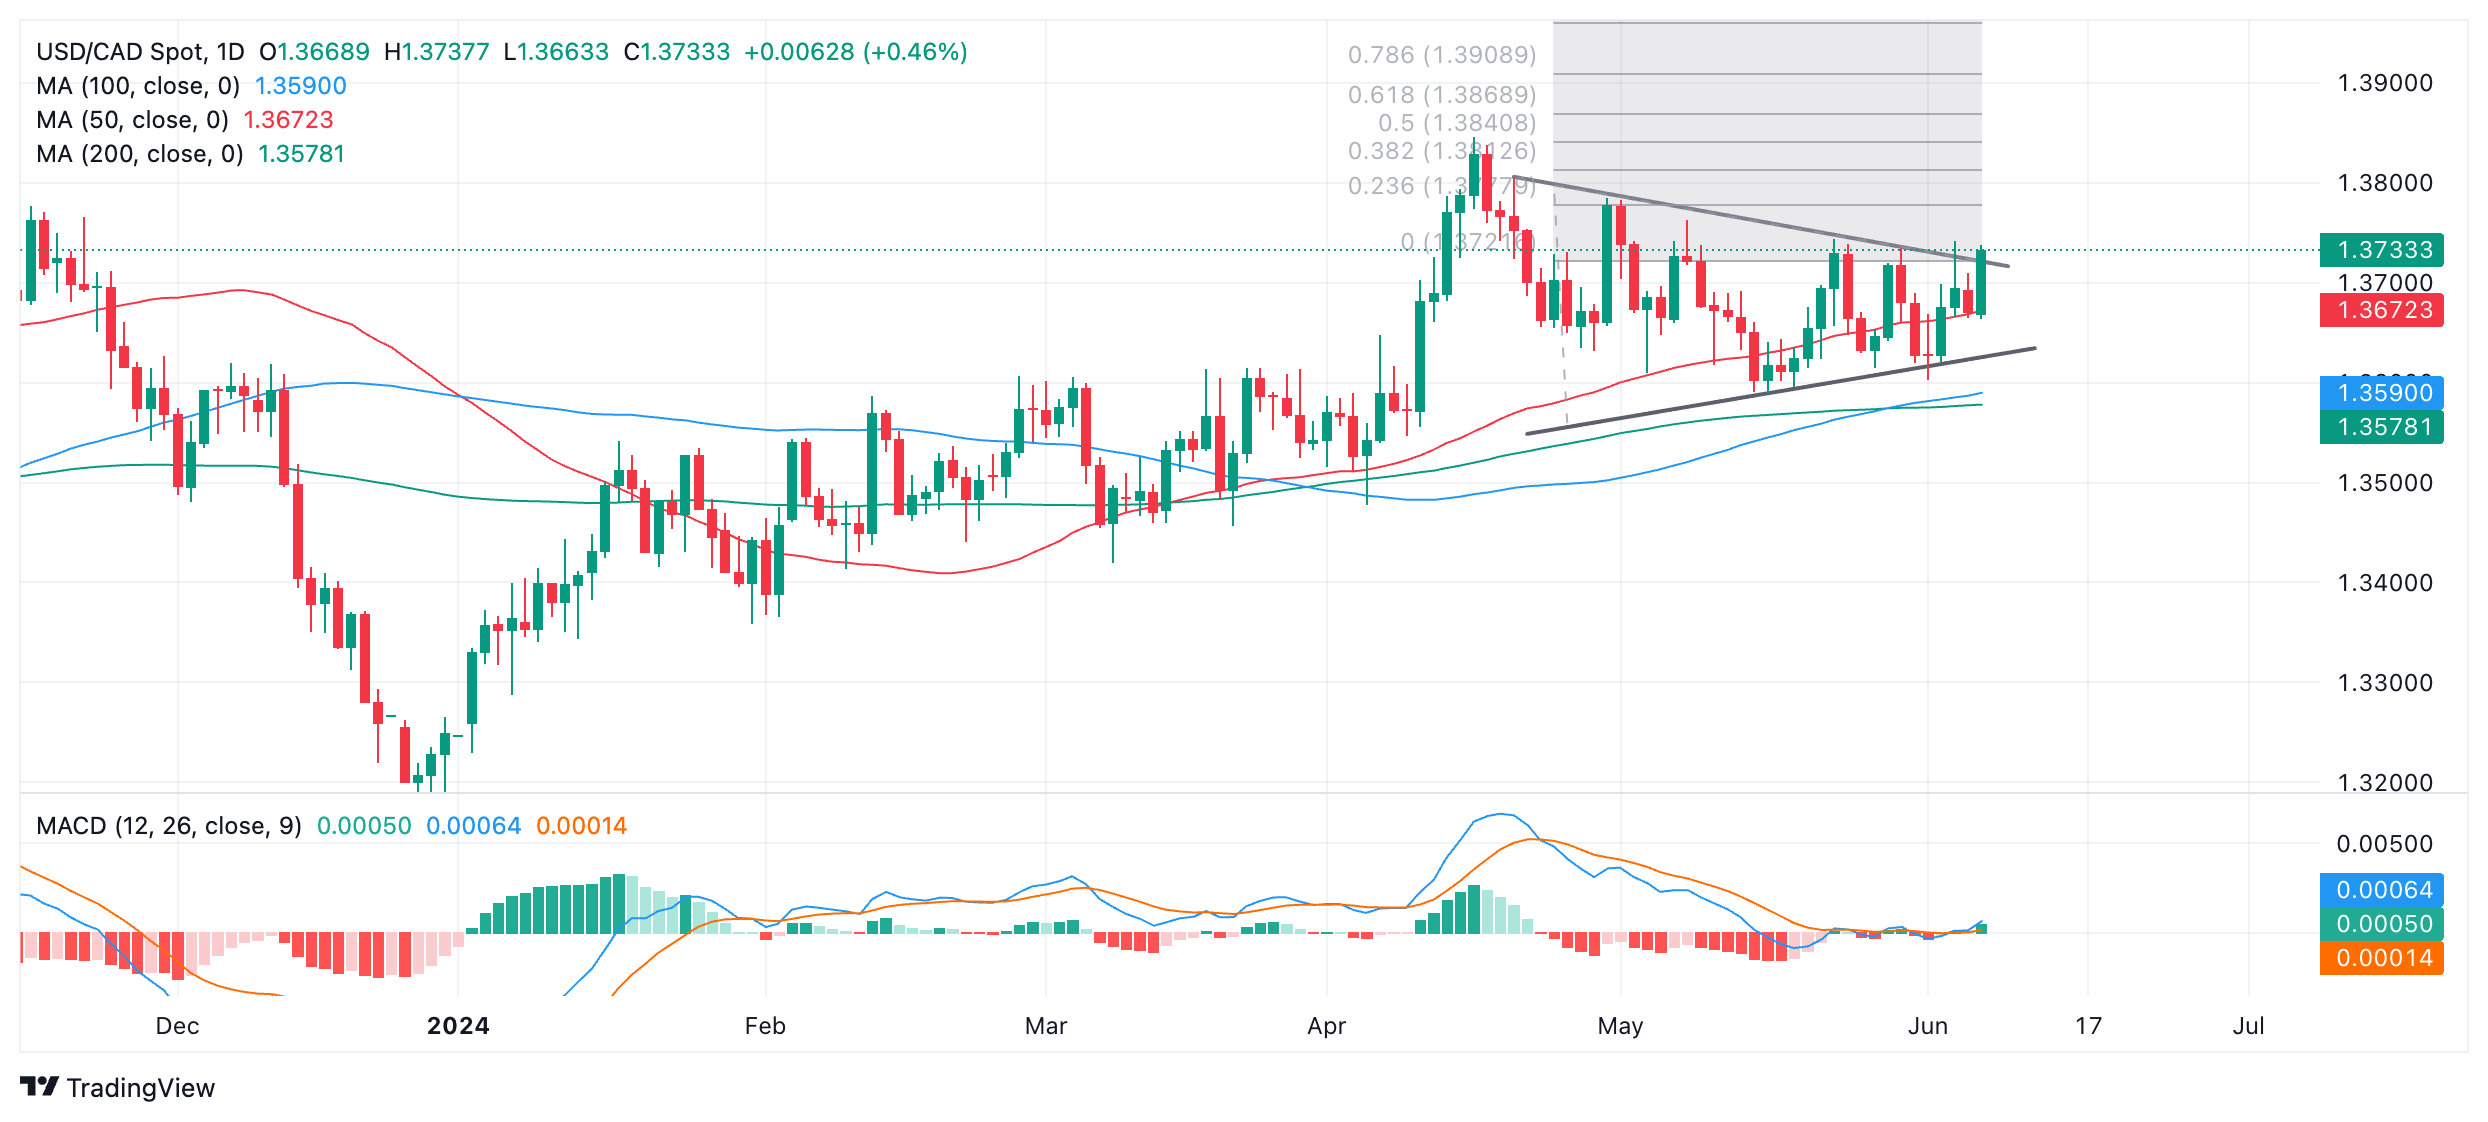
USD/CAD is pushing up against the upper borderline of a large symmetrical triangle price pattern, threatening to break out to the upside.
USD/CAD Daily Chart
A decisive breakout from the triangle would activate the initial upside target for the pattern at 1.3869, the 0.618 Fibonacci extrapolation of the height of the triangle from the breakout point higher.
A decisive break would be one accompanied by a long green daily candlestick that broke clearly through the level and closed near its high or three green candlesticks in a row that broke through the level.
USD/CAD has broadly-speaking been in an uptrend since the start of 2024. During that time it has risen from the 1.31s to the current 1.37s. Given that “the trend is your friend” the odds favor a continuation of the bull trend.
Since April USD/CAD has been trading sideways in a narrowing range like a triangle. This is a type of continuation pattern. The probabilities favor price breaking out to the upside in line with the prior trend. The pattern has also completed five internal waves which is the minimum requirement for a triangle.
The breakout, when it happens, is likely to be quite volatile. Traders should be warned that false breakouts are quite common. For more confidence a move above 1.3762 (May 8 high) should be used as confirmation.
A decisive breakdown from the triangle would reverse the trend and suggest a move down to an initial target at around 1.3483.