Canadian Dollar stuck in place as markets buckle down ahead of Fed ‘dot plot’ update

- Canadian Dollar trades steadily on Tuesday with little momentum.
- Canada brings strictly low-tier data to the table this week.
- Fed rate cut expectations still dominate market outlook.
The Canadian Dollar (CAD) is trading mostly flat on Tuesday as investors stubbornly dig in their heels ahead of Wednesday’s key data prints from the US. US Consumer Price Index (CPI) inflation is slated for the midweek market session, followed by a fresh rate call from the Federal Reserve (Fed) that is broadly expected to hold rates in the 500-525 basis point range.
Canada is limited to just low-tier economic data releases this week, except for a single showing from the Bank of Canada’s (BoC) Governor Tiff Macklem, who is slated to make an appearance on Wednesday. However, the BoC Governor’s statement is likely to get drowned out by market reactions to shifts in the Fed’s “dot plot” of Interest Rate Projections due at the same time as the Fed’s rate call this week.
Daily digest market movers: Markets getting nervous ahead of mega Wednesday Fed showing
- CAD finds little reason to move, trades within a quarter of a percent against its peers.
- Canadian Building Permits surged by 20.5% in April, the highest MoM change in four years.
- Markets are hoping that US CPI inflation cools to 0.1% MoM in May, down from the previous 0.3%.
- US Core CPI is forecast to tick down to 3.5% YoY versus the previous 3.6%.
- Fed is broadly expected to keep rates where they are for now, but investors will be keenly focused on Fed’s updated “dot plot” on Wednesday.
- Rate markets see slightly better-than-even odds of at least a quarter-point cut from the Fed in September, according to the CME’s FedWatch Tool.
Canadian Dollar PRICE Today
The table below shows the percentage change of Canadian Dollar (CAD) against listed major currencies today. Canadian Dollar was the strongest against the Euro.
| USD | EUR | GBP | JPY | CAD | AUD | NZD | CHF | |
|---|---|---|---|---|---|---|---|---|
| USD | 0.26% | 0.05% | 0.19% | 0.07% | 0.18% | -0.08% | 0.23% | |
| EUR | -0.26% | -0.21% | -0.07% | -0.19% | -0.07% | -0.34% | -0.02% | |
| GBP | -0.05% | 0.21% | 0.14% | 0.01% | 0.12% | -0.14% | 0.17% | |
| JPY | -0.19% | 0.07% | -0.14% | -0.12% | -0.02% | -0.29% | 0.04% | |
| CAD | -0.07% | 0.19% | -0.01% | 0.12% | 0.11% | -0.16% | 0.16% | |
| AUD | -0.18% | 0.07% | -0.12% | 0.02% | -0.11% | -0.27% | 0.04% | |
| NZD | 0.08% | 0.34% | 0.14% | 0.29% | 0.16% | 0.27% | 0.32% | |
| CHF | -0.23% | 0.02% | -0.17% | -0.04% | -0.16% | -0.04% | -0.32% |
The heat map shows percentage changes of major currencies against each other. The base currency is picked from the left column, while the quote currency is picked from the top row. For example, if you pick the Canadian Dollar from the left column and move along the horizontal line to the US Dollar, the percentage change displayed in the box will represent CAD (base)/USD (quote).
Technical analysis: CAD cycles familiar levels, but some Greenback strength pokes through
The Canadian Dollar (CAD) is trading tightly on Tuesday, refusing to give up too much ground to the Greenback and sticking to familiar intraday technical levels. Elsewhere, the Canadian Dollar is finding small gains, climbing around a fifth of one percent against the Euro (EUR), Swiss Franc (CHF) and Japanese Yen (JPY).
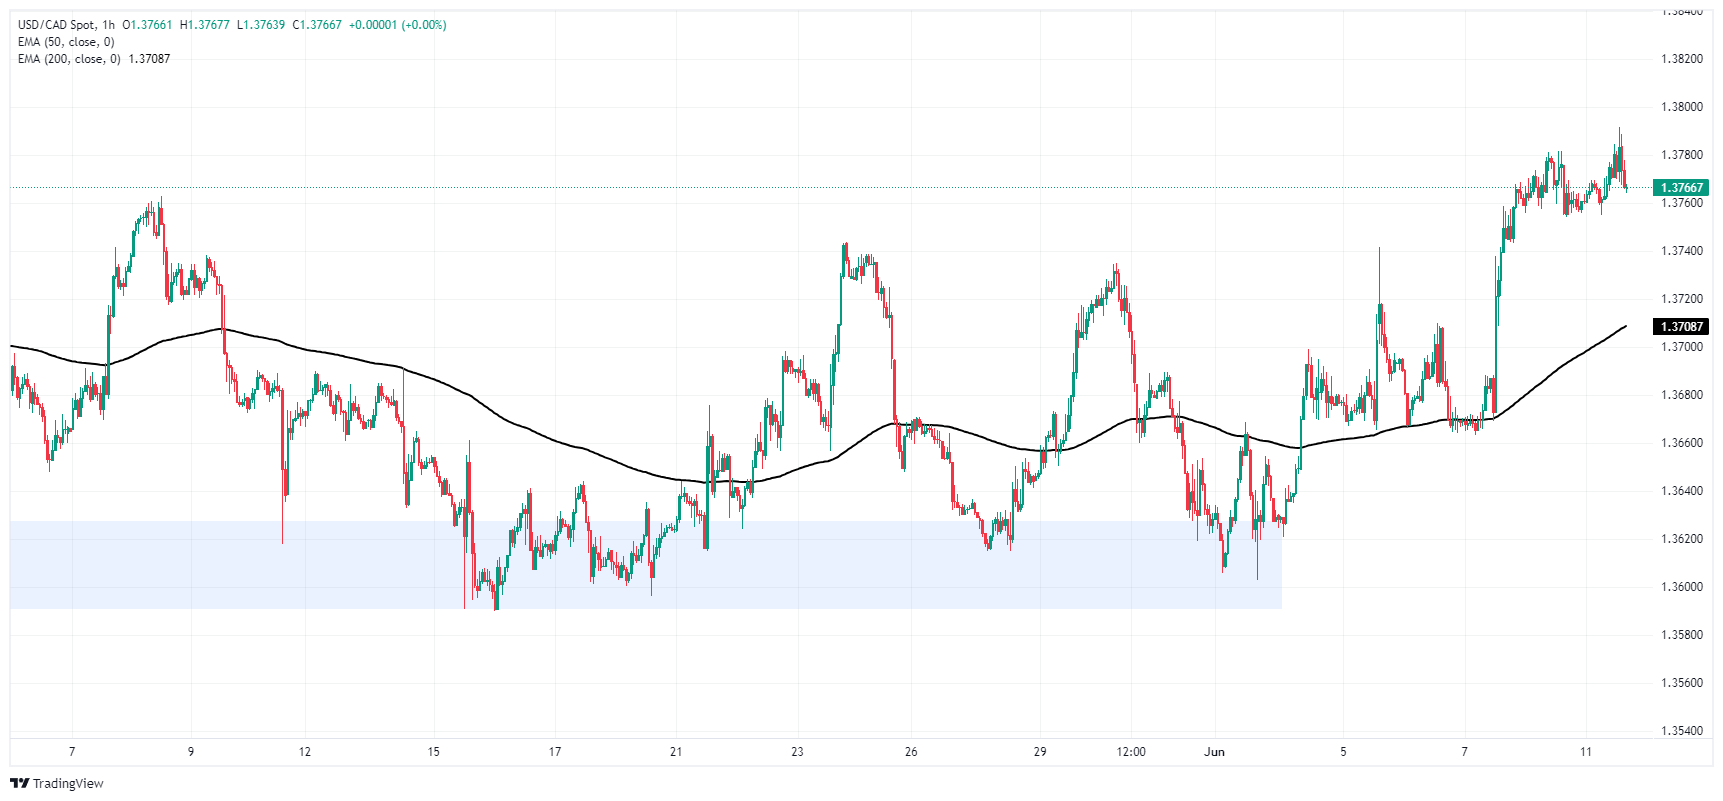
USD/CAD briefly tested above 1.3780 in early Tuesday trading as the US Dollar builds on minor risk-off flows, but the CAD is holding steady, limiting movement in the pair. CAD bidders will be looking for Greenback weakness to drag USD/CAD back down from the 1.3800 handle.
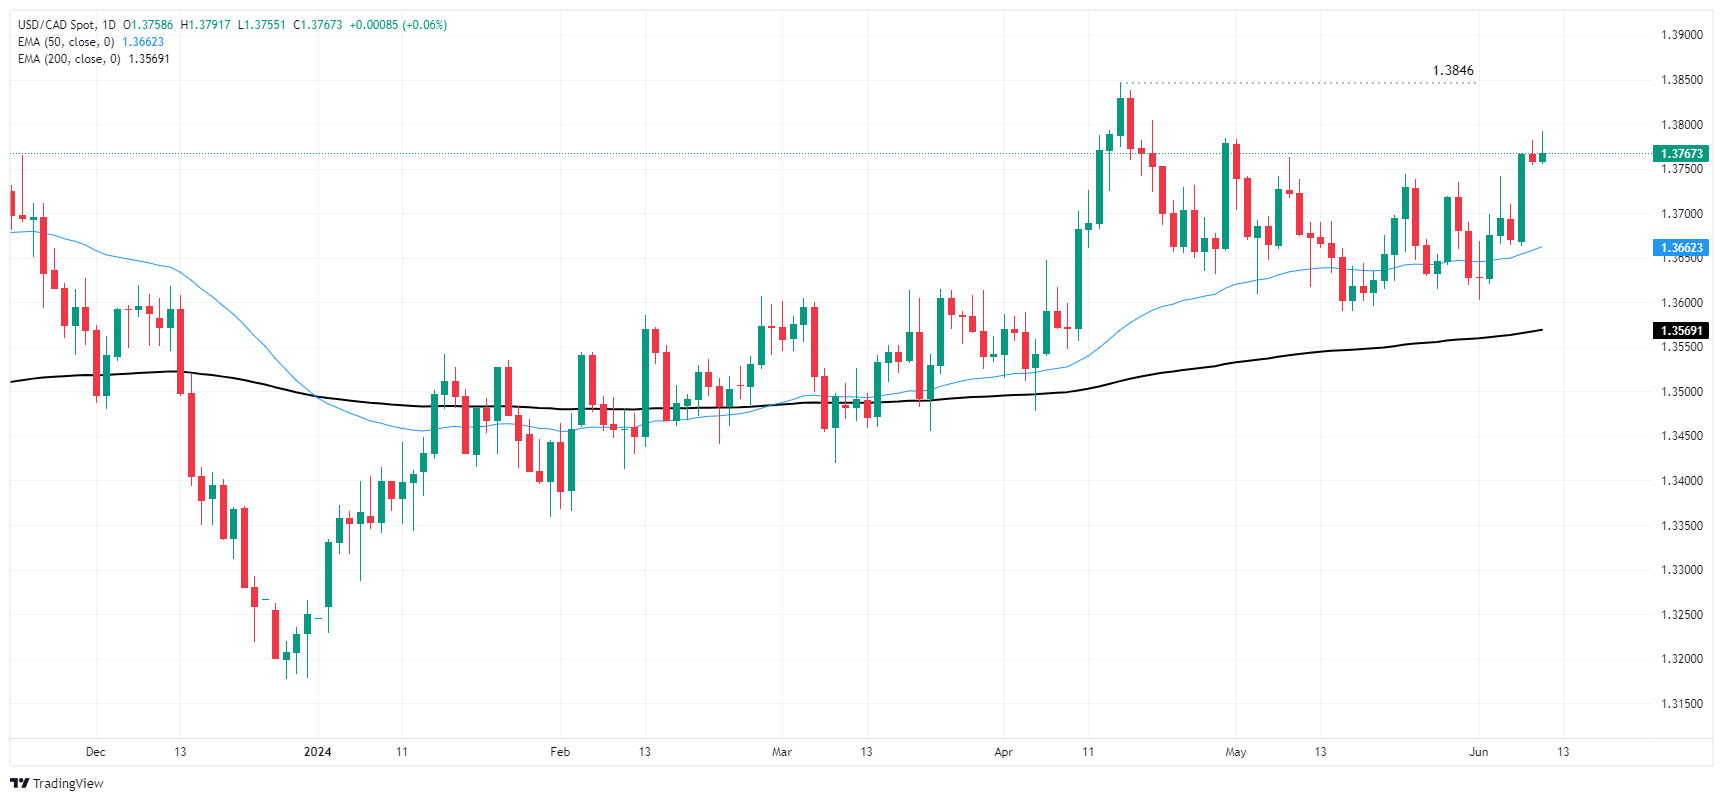
2024’s highs rest at 1.3846, and any downside plunges in USD/CAD will find a demand zone just above the 1.3600 handle. Daily candlesticks are still holding on the high side, trading up nearly 4% for the year.
USD/CAD hourly chart
USD/CAD daily chart
Economic Indicator
Consumer Price Index (MoM)
Inflationary or deflationary tendencies are measured by periodically summing the prices of a basket of representative goods and services and presenting the data as The Consumer Price Index (CPI). CPI data is compiled on a monthly basis and released by the US Department of Labor Statistics. The MoM figure compares the prices of goods in the reference month to the previous month.The CPI is a key indicator to measure inflation and changes in purchasing trends. Generally, a high reading is seen as bullish for the US Dollar (USD), while a low reading is seen as bearish.
