
Canadian Dollar holds steady in the midrange as markets await meaningful data
- Canadian Dollar treads lightly amidst quiet Monday markets.
- Canada Housing Starts rise faster than expected in May, but sales and prices are down.
- US NY Empire Manufacturing recovered, but Tuesday’s Retail Sales loom ahead.
The Canadian Dollar (CAD) is trading tightly on Monday, with gains and losses mixed across the board and within a quarter of a percent against most of its major currency peers. Canadian Housing Starts came in better than expected, but prices and activity remain lower in May. US manufacturing figures improved more than expected but still remain in contraction territory.
Canada saw Housing Starts rise more than expected for the year ending in May, but according to the Canadian Real Estate Association (CREA), both housing prices and buying activity declined in May. The US New York Empire Manufacturing Index rose faster than expected in June but still remains mired in contraction territory. Markets will shift into wait-and-see mode as investors look out for US Retail Sales figures due on Tuesday.
Daily digest market movers: Canadian Dollar finds tepid Monday markets and a limited data docket
- Canadian Housing Starts rose to 264.5K YoY in May, above the forecast for 247K and rising from the previous period’s revised 241.1K.
- However, the CREA’s Canadian Home Price Index fell 0.2% MoM in May and fell 2.4% YoY. The CREA also noted that home sales declined 0.6% MoM in May as activity remains constrained.
- The US NY Empire State Manufacturing Index recovered to a four-month high of -6.0 in June, higher than the forecast of -9.0 and well above the previous -15.6. Despite the recovery, the NY Empire index has remained in contraction territory since November of last year.
- Tuesday’s US Retail Sales will be the key data release of the early week, and investors will be keeping one eye turned to the news feeds. A slew of policymakers from the Federal Reserve are expected to appear this week.
- Wednesday’s Juneteenth US holiday will see a lull in the midweek market flow.
Canadian Dollar PRICE Today
The table below shows the percentage change of Canadian Dollar (CAD) against listed major currencies today. Canadian Dollar was the strongest against the New Zealand Dollar.
| USD | EUR | GBP | JPY | CAD | AUD | NZD | CHF | |
|---|---|---|---|---|---|---|---|---|
| USD | -0.21% | -0.08% | 0.24% | -0.02% | 0.13% | 0.17% | 0.05% | |
| EUR | 0.21% | 0.14% | 0.47% | 0.20% | 0.24% | 0.42% | 0.26% | |
| GBP | 0.08% | -0.14% | 0.40% | 0.05% | 0.08% | 0.24% | 0.13% | |
| JPY | -0.24% | -0.47% | -0.40% | -0.15% | -0.11% | 0.08% | -0.14% | |
| CAD | 0.02% | -0.20% | -0.05% | 0.15% | 0.08% | 0.19% | 0.07% | |
| AUD | -0.13% | -0.24% | -0.08% | 0.11% | -0.08% | 0.24% | 0.05% | |
| NZD | -0.17% | -0.42% | -0.24% | -0.08% | -0.19% | -0.24% | -0.12% | |
| CHF | -0.05% | -0.26% | -0.13% | 0.14% | -0.07% | -0.05% | 0.12% |
The heat map shows percentage changes of major currencies against each other. The base currency is picked from the left column, while the quote currency is picked from the top row. For example, if you pick the Canadian Dollar from the left column and move along the horizontal line to the US Dollar, the percentage change displayed in the box will represent CAD (base)/USD (quote).
Technical analysis: Canadian Dollar churns in the midrange on Monday
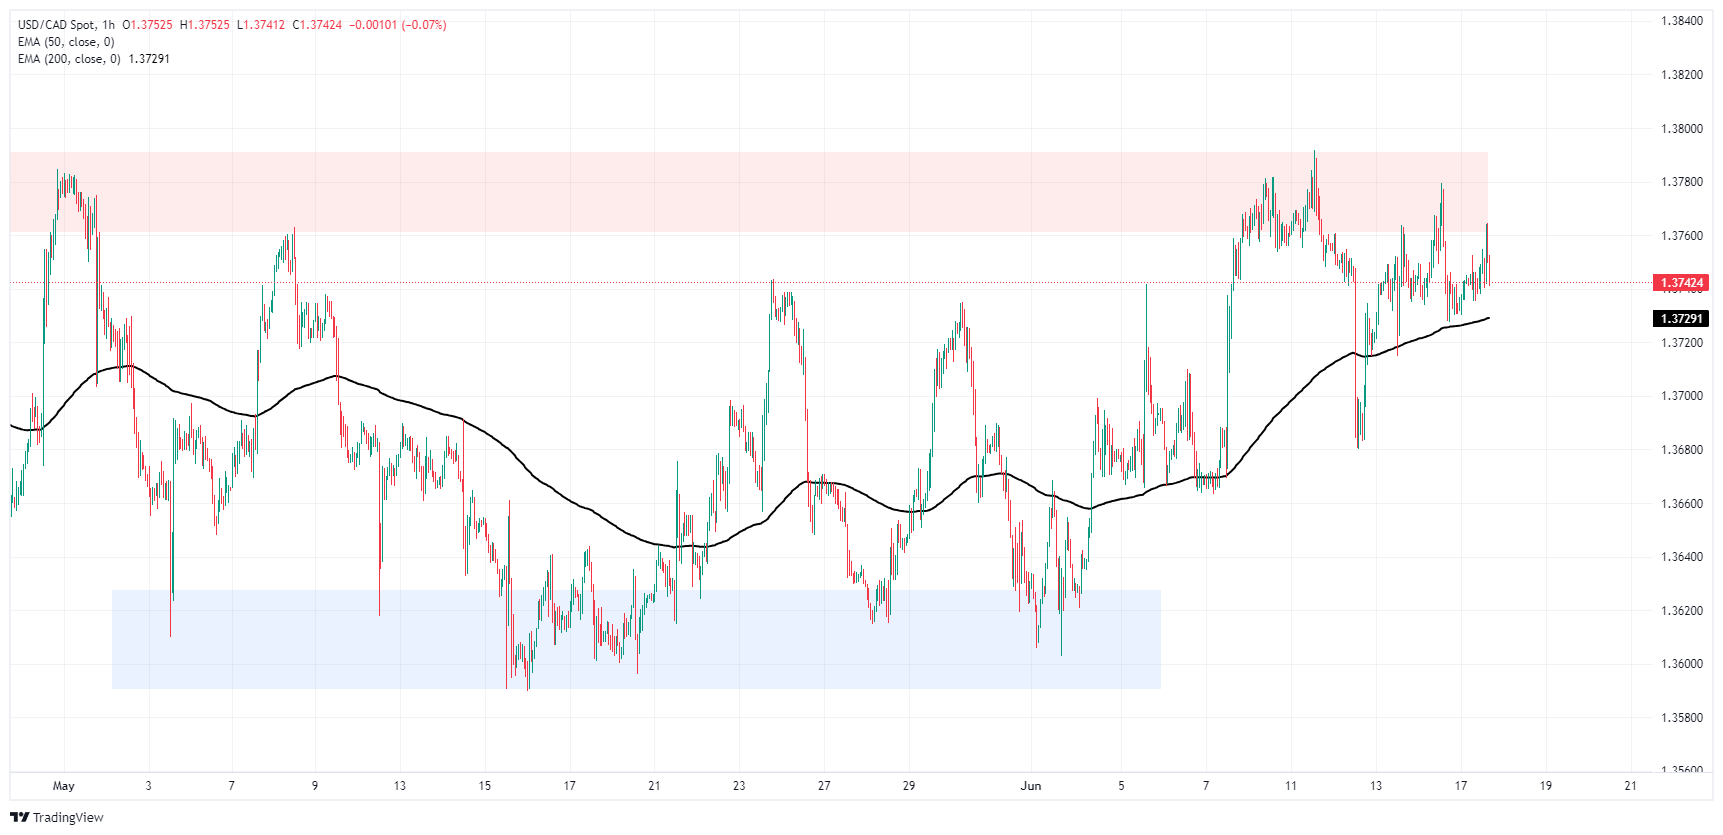
The Canadian Dollar (CAD) is comfortably splashing around in the shallow end on Monday, trading within a quarter of one percent across the board as markets kick off the new trading week on a notably tepid note. USD/CAD briefly found an intraday high above 1.3760 before pulling back into a familiar midrange near 1.3740.
Intraday price action remains mired on the low side of a heavy supply zone above 1.3760, but long-term momentum still leans into the bullish side as the pair holds north of the 50-day Exponential Moving Average (EMA) at 1.3673. USD/CAD has been grinding higher on a rising trendline, climbing from December’s swing low below 1.3200, but the pair has failed to etch in a fresh high since peaking at 1.3846 in mid-April.
USD/CAD hourly chart
USD/CAD daily chart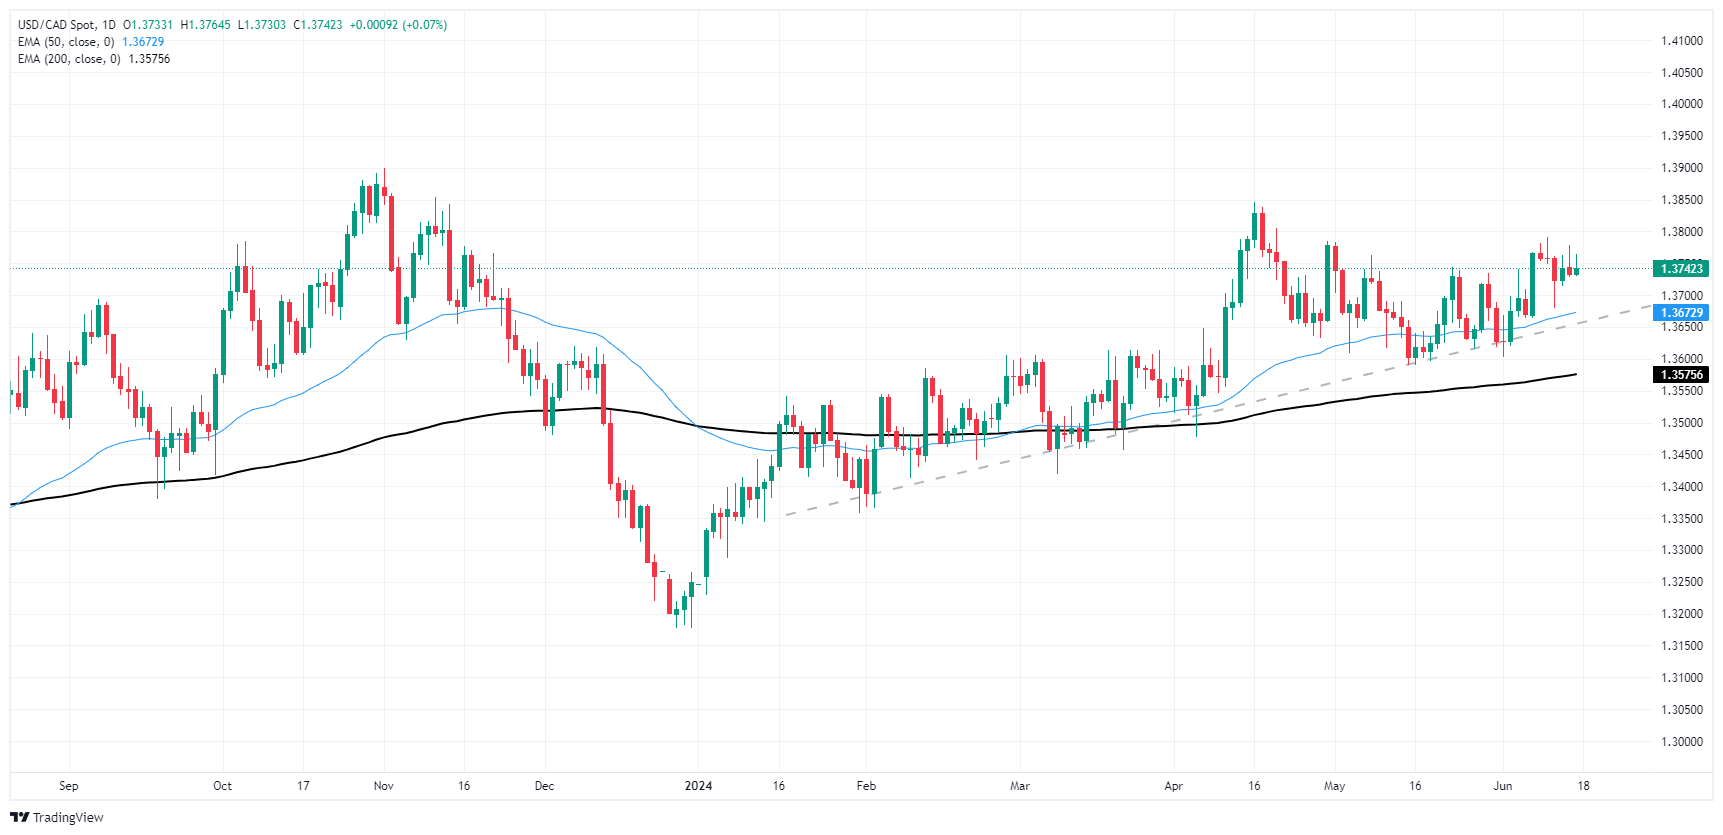
Economic Indicator
Retail Sales (MoM)
The Retail Sales data, released by the US Census Bureau on a monthly basis, measures the value in total receipts of retail and food stores in the United States. Monthly percent changes reflect the rate of changes in such sales. A stratified random sampling method is used to select approximately 4,800 retail and food services firms whose sales are then weighted and benchmarked to represent the complete universe of over three million retail and food services firms across the country. The data is adjusted for seasonal variations as well as holiday and trading-day differences, but not for price changes. Retail Sales data is widely followed as an indicator of consumer spending, which is a major driver of the US economy. Generally, a high reading is seen as bullish for the US Dollar (USD), while a low reading is seen as bearish.
Next release: Tue Jun 18, 2024 12:30
Frequency: Monthly
Consensus: 0.2%
Previous: 0%
Source: US Census Bureau