NZD/USD Price Analysis: Continues losing streak amid firm US Dollar

- NZD/USD falls further to 0.6140 as the Fed’s hawkish remarks improve the US Dollar’s appeal.
- Sost US inflation reports have prompted Fed rate-cut prospects for September.
- China’s weak data weighs on the New Zealand Dollar.
The NZD/USD pair extends its losing streak for the third trading day on Monday. The Kiwi asset declines to near 0.6140 as the US Dollar (USD) clings to gains amid a tug of war between Federal Reserve (Fed) and market speculation for how much interest rates will be reduced this year.
Fed policymakers have acknowledged that the progress in inflation declining to bank’s target of 2% has resumed after the release of the cooler consumer and producer inflation reports for May. However, they want to see price pressures declining for months before considering rate cuts. Therefore, they expect room for only one rate-cut this year.
However, soft inflation reports have boosted market expectations for two rate cuts this year. The CME FedWatch tool shows that the Fed will start reducing interest rates from the September meeting and will cut again in the November or December meeting.
Meanwhile, the New Zealand Dollar weakens after various Chinese economic indicators suggested uncertainty over the economic outlook. In May, the House Price Index deflated by 3.9%, and Industrial Production and YTD Fixed Asset Investment grew slower than expected by 5.6% and 4%, respectively. However, Retail Sales rose by 3.7%, beat expectations of 3% and the prior release of 2.3%. The New Zealand (NZ) economy is one of the leading trading partners of China, and the latter’s weak economic performance impacts the Kiwi dollar.
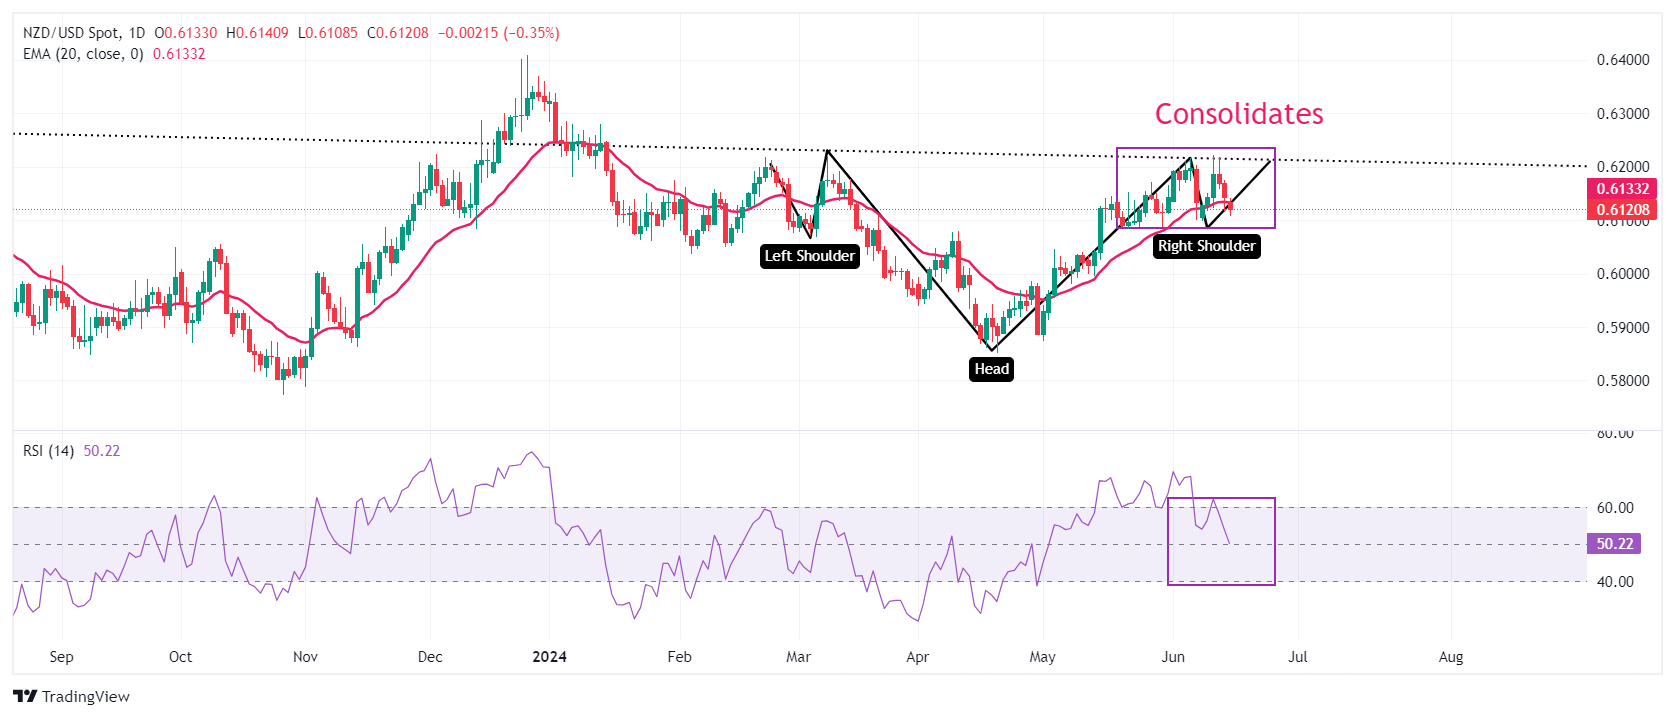
NZD/USD declines while attempting to deliver a breakout of the Inverted Head and Shoulder (H&S) chart pattern formed on a daily timeframe. The neckline of the above-mentioned chart pattern is marked near 0.6215. The asset has declined below the 20-day Exponential Moving Average (EMA) near 0.6130, which indicates an uncertain near-term outlook.
The 14-period Relative Strength Index (RSI) falls back into the 40.00-60.00 range, indicating that the upside momentum has faded.
Fresh downside would appear if the asset breaks below April 4 high around 0.6050 This would drag the asset towards the psychological support of 0.6000 and April 25 high at 0.5969.
On the contrary, a reversal move above June 12 high of 0.6222, which will expose the asset January 15 high near 0.6250, followed by January 12 high near 0.6280.
