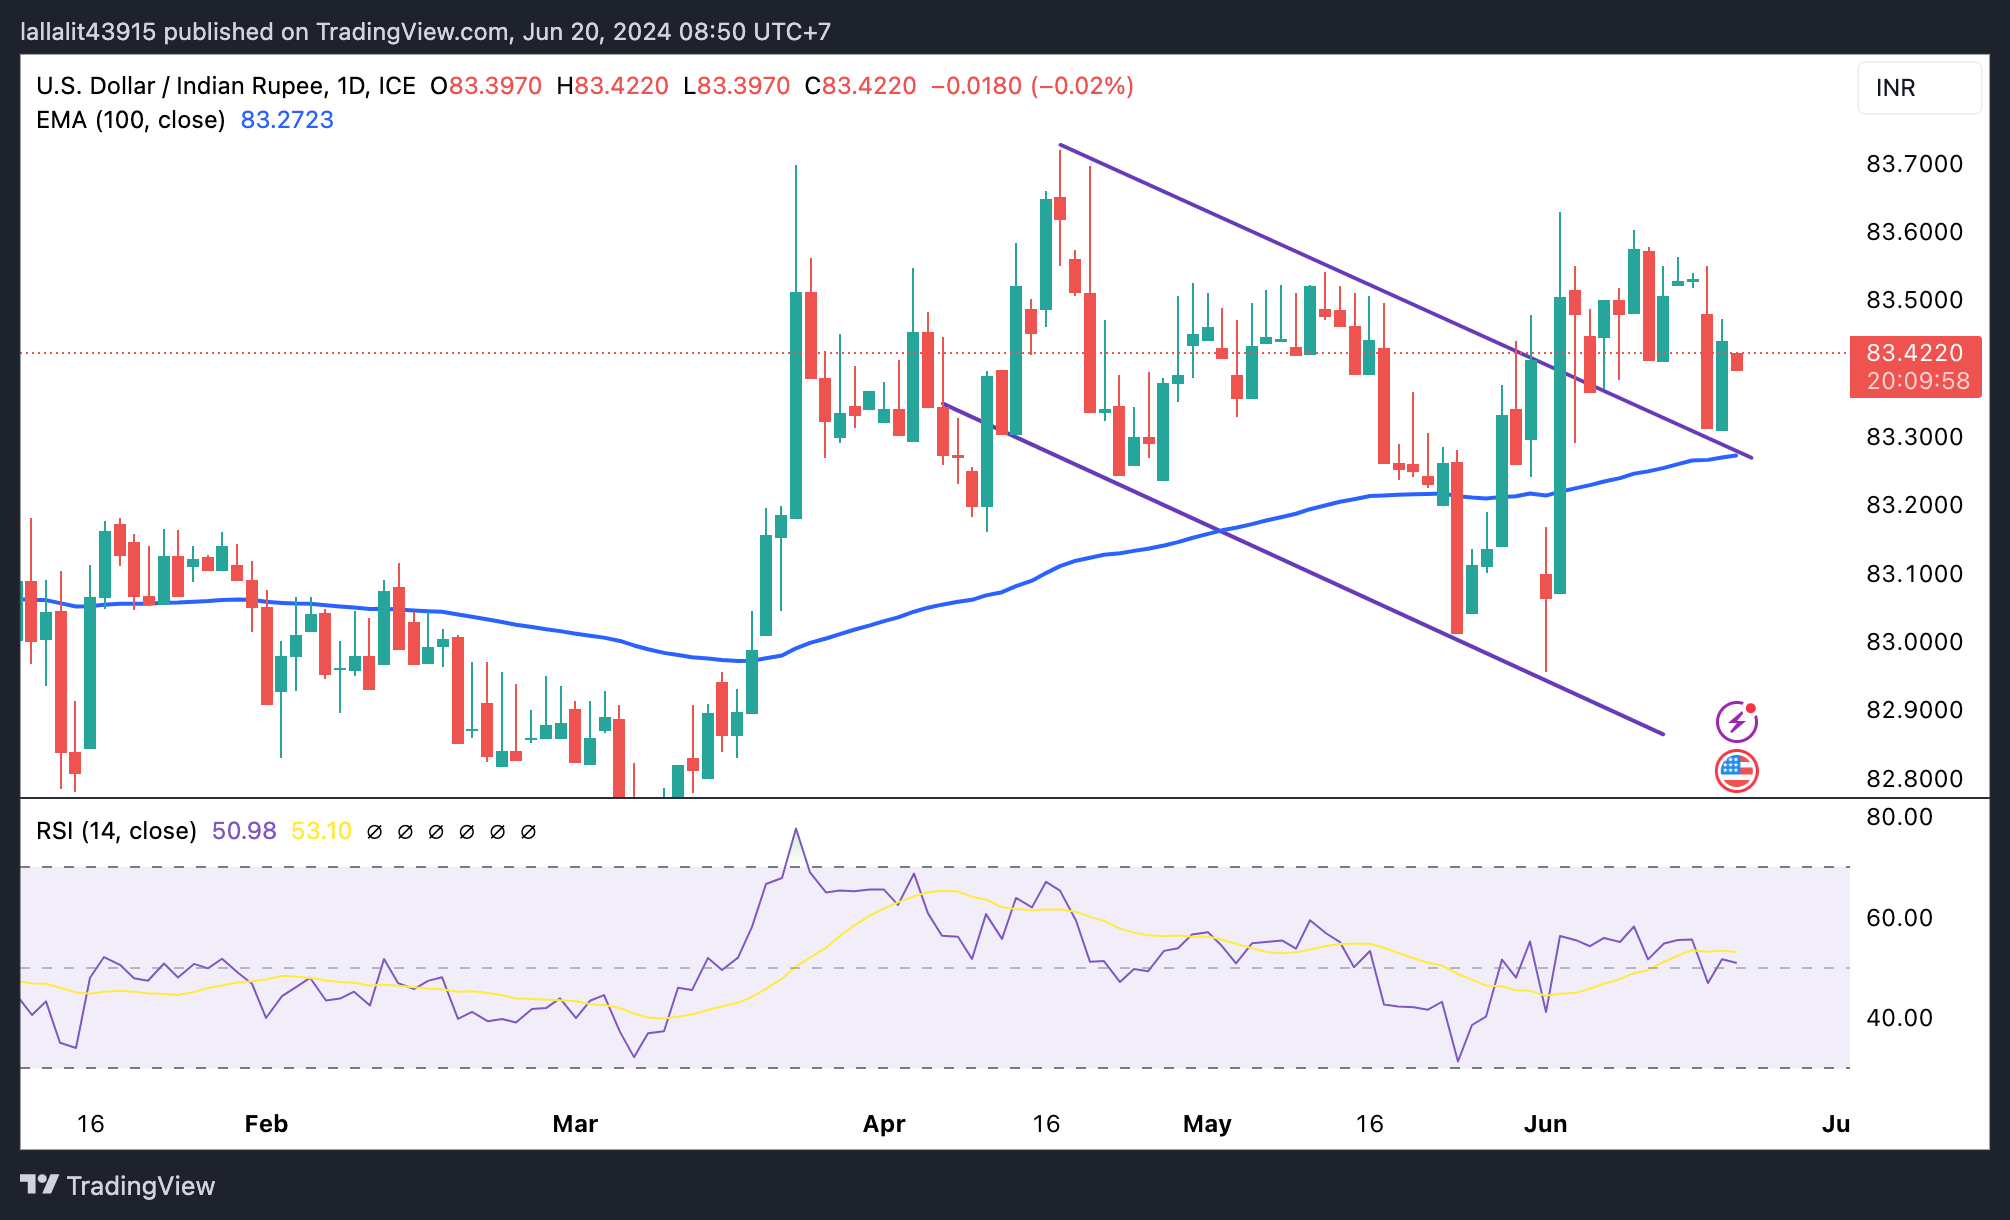
USD/INR weakens on India’s foreign inflows, Fed rate cuts bet

- The Indian Rupee (INR) posts modest gains on the softer US Dollar on Thursday.
- Significant inflows into Indian markets might support the INR, while renewed US Dollar demand could cap the upside.
- Investors await the US weekly Initial Jobless Claims, Housing data, and Philly Fed Manufacturing Index, which are due on Thursday.
The Indian Rupee (INR) trades with mild gains on Thursday amid the modest decline of the US Dollar (USD). The INR depreciation on Wednesday underscores the pressure from local importers and oil companies demanding USD. Furthermore, the rise in crude oil prices might contribute to the INR’s downside as India is the third largest consumer of crude oil in the world, after the United States and China.
Nonetheless, the significant inflows into Indian equities and bond markets could boost the INR in the near term. Meanwhile, the speculation that the US Federal Reserve (Fed) might cut the interest rate two times in 2024, beginning in September, might undermine the Greenback and create a headwind for the pair.
Looking ahead, the US weekly Initial Jobless Claims, Building Permits, Housing Starts and the Philly Fed Manufacturing Index will be released on Thursday. The attention will shift to the Indian HSBC Manufacturing and Services PMI on Friday, along with the US S&P Global PMI reports.
Daily Digest Market Movers: Indian Rupee recovers amid strong inflow into Indian markets
- Indian equity indices reached fresh record highs for the fourth consecutive session before ending on a flat note. The BSE Sensex ended at 77,337.59, up 36.46 points or 0.05%, while the Nifty50 closed at 23,516, down 41.90 points or 0.18%.
- The Indian Rupee may rise beyond 83.20 once inflows from India’s inclusion in the JPMorgan emerging market debt index begin later this month, said Sajal Gupta, head of FX and commodities at Nuvama Wealth Management’s institutional desk.
- Fitch Ratings raised India’s growth forecast from 7% in March to 7.2% due to the recovery in consumer spending and increased investment.
- “The Rupee is likely to hold in the 83-83.55 band in the next few trading sessions” with the Reserve Bank of India firmly capping sharp declines below 83.55,” said Anil Kumar Bhansali, head of treasury at Finrex Treasury Advisors.
- Traders have priced in a nearly 67% chance of a 25 basis points (bps) rate cut in September, up from 61% a day ago, according to the CME FedWatch tool.
- The US Initial Jobless Claims for the week ending June 15 are estimated to drop to235K from the previous week of 242K.
Technical analysis: USD/INR paints a positive picture in the longer term
The Indian Rupee trades stronger on the day. The USD/INR pair maintains the constructive outlook unchanged above the key 100-day Exponential Moving Average (EMA) on the daily chart. Nonetheless, further consolidation looks favorable amid the neutral level of the 14-day Relative Strength Index (RSI).
In the bullish case, the first upside target for the pair will emerge at 83.55 (high of June 18). The next barrier is located at 83.72 (high of April 17) and then the 84.00 psychological level.
On the flip side, the key support level is seen near 83.30, the 100-day EMA. Any follow-through selling below this level will pave the way to 83.00 (round figure), followed by 82.78 (low of January 15).
US Dollar price today
The table below shows the percentage change of US Dollar (USD) against listed major currencies today. US Dollar was the weakest against the Australian Dollar.
| USD | EUR | GBP | CAD | AUD | JPY | NZD | CHF | |
| USD | 0.00% | 0.00% | 0.00% | 0.00% | 0.00% | 0.14% | 0.00% | |
| EUR | -0.07% | -0.04% | 0.00% | 0.03% | 0.01% | 0.07% | -0.02% | |
| GBP | -0.01% | 0.00% | 0.01% | 0.02% | 0.00% | -0.01% | 0.01% | |
| CAD | 0.00% | 0.00% | 0.00% | 0.02% | -0.01% | -0.02% | 0.00% | |
| AUD | 0.01% | 0.02% | 0.02% | 0.01% | 0.00% | 0.00% | 0.01% | |
| JPY | 0.00% | 0.00% | 0.01% | -0.01% | 0.03% | 0.00% | 0.03% | |
| NZD | 0.01% | 0.01% | 0.02% | 0.02% | 0.03% | 0.03% | 0.00% | |
| CHF | 0.02% | -0.01% | -0.01% | 0.00% | 0.02% | -0.03% | -0.02% |
The heat map shows percentage changes of major currencies against each other. The base currency is picked from the left column, while the quote currency is picked from the top row. For example, if you pick the Euro from the left column and move along the horizontal line to the Japanese Yen, the percentage change displayed in the box will represent EUR (base)/JPY (quote).
