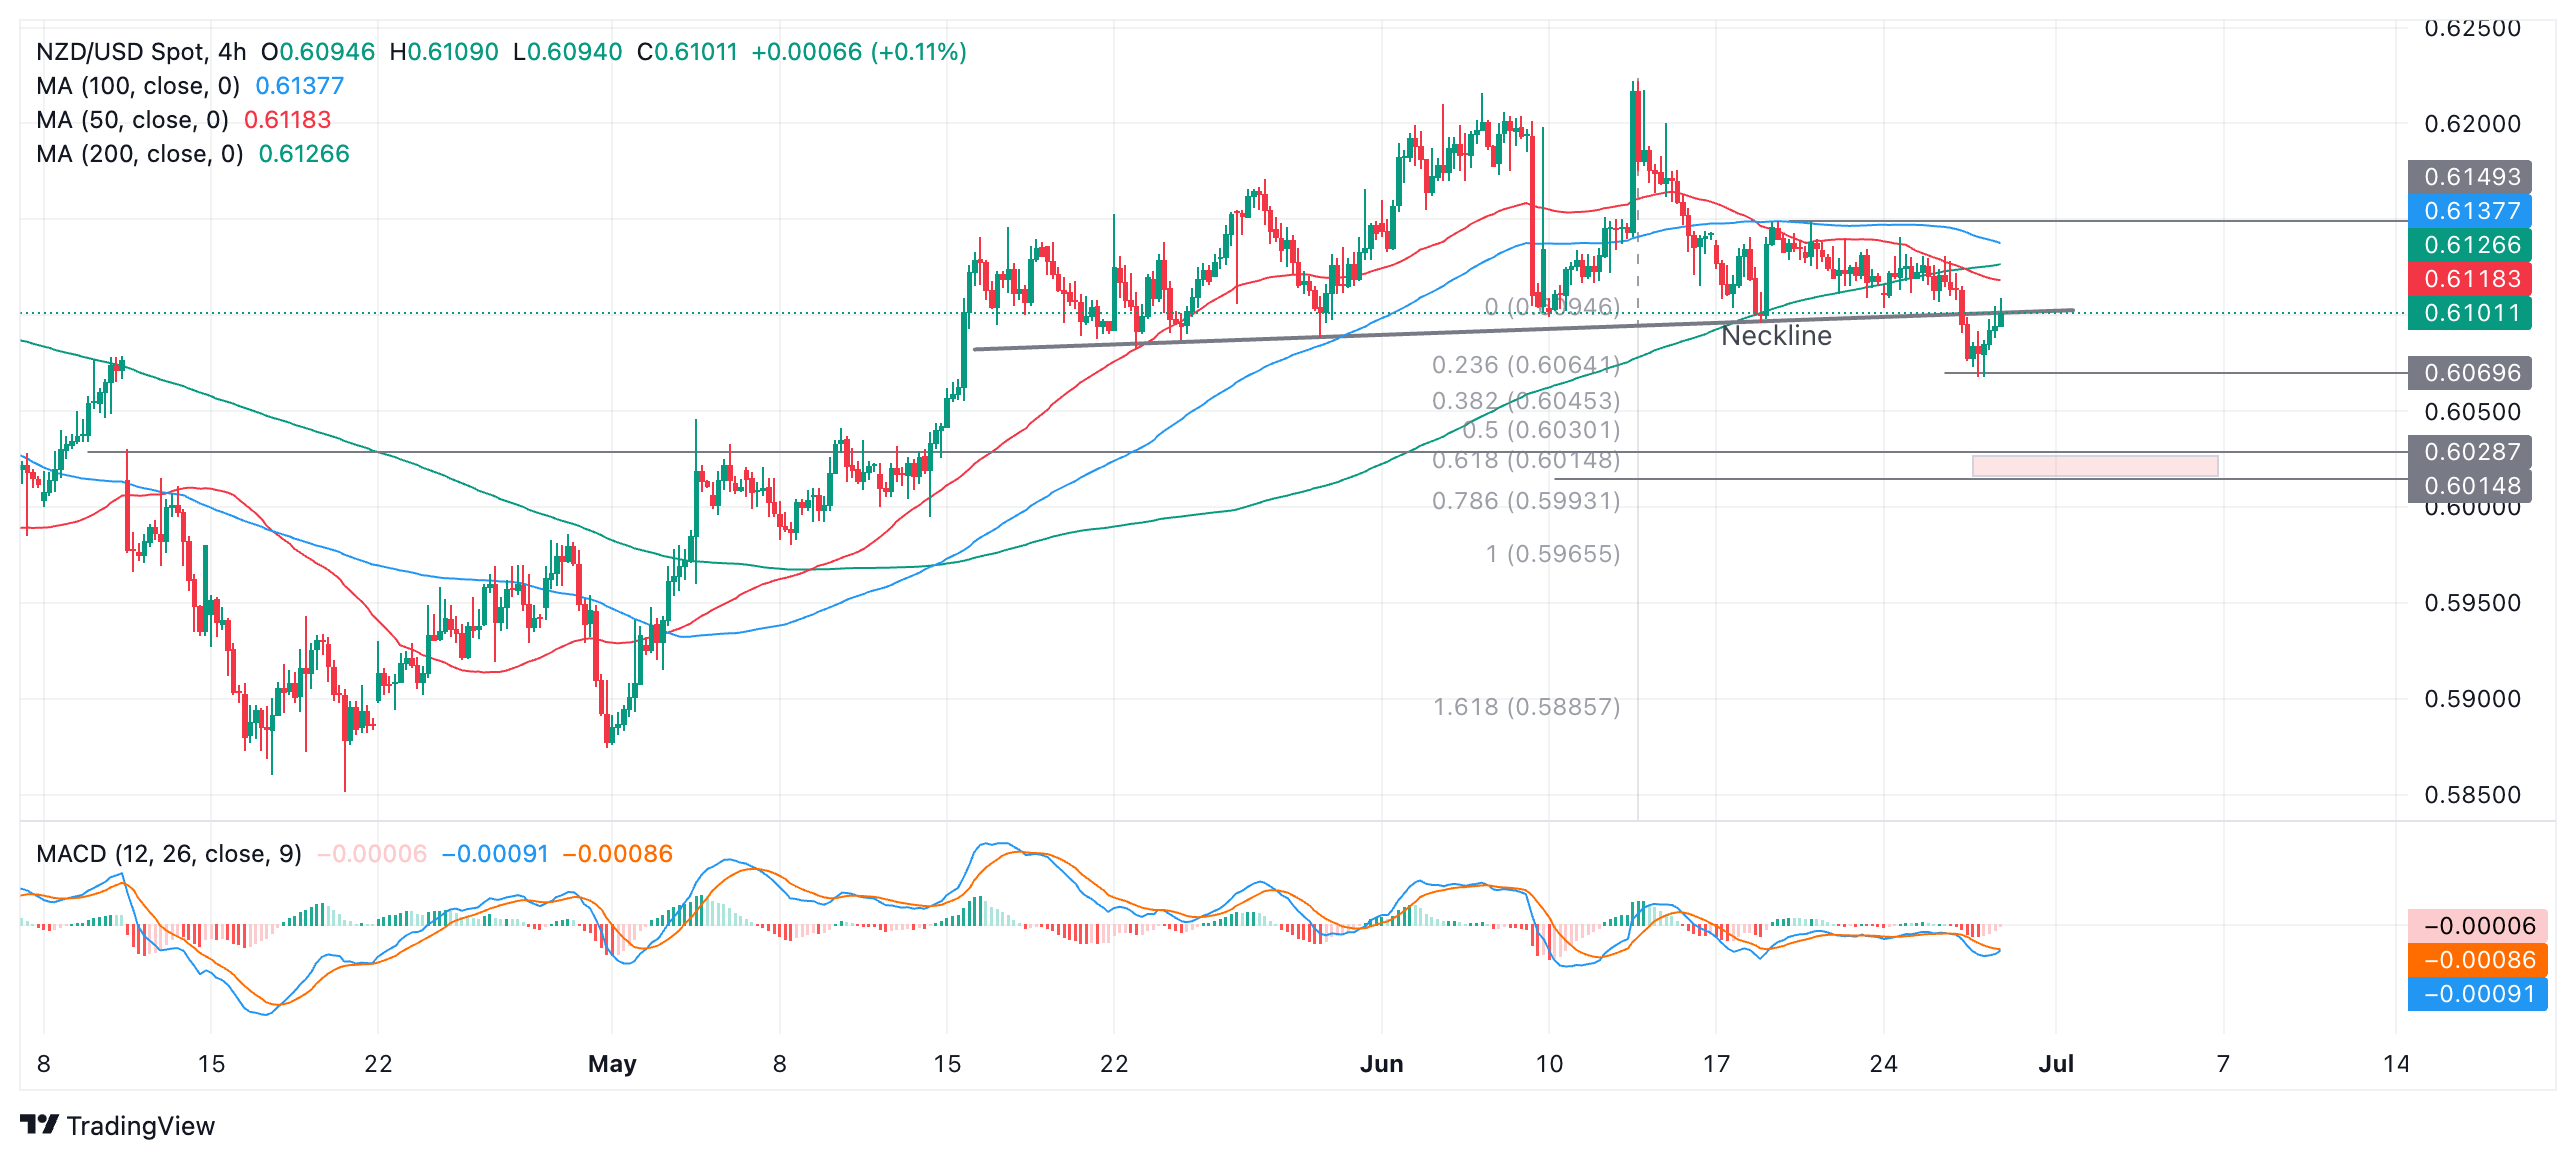
NZD/USD undergoing a throwback after piercing neckline

- NZD/USD is recovering in a throwback move to the neckline of a topping pattern it recently pierced.
- The pair is at a critical point – whilst the odds favor a resumption of the downside bias, a continuation higher is possible.
- A break below the June 26 low would confirm a continuation down to a target for the topping pattern.
NZD/USD has formed a complex multi-peak topping pattern which is at risk of breaking down now that the pair’s “neckline” – the level underpinning its trough lows – at around 0.6100, has been decisively pierced.
NZD/USD 4-hour Chart
NZD/USD pierced cleanly through the neckline on June 26 and fell to a low of 0.6068. However, it quickly mounted a recovery and returned back to the neckline.
The recovery back up to the neckline could be what is called a “throwback” in technical parlance. This is a move that comes immediately after a breakout from a chart pattern in which the price recovers back to the original boundary line, or in this case neckline.
The throwback is usually only a temporary recovery before price surrenders to the overwhelming downwards pressure and falls back down to the pattern’s breakout target. However, this is not always the case and sometimes price will recover.
A break below the June 26 low at 0.6068 would provide confirmation of a resumption of the downmove, to a target in a zone (shaded red) between 0.6028 (bottom of April 10 price gap) and 0.6015, the Fibonacci 0.618 extension of the height of the pattern.
This is a conservative estimate and it is possible the pair could go even lower to 0.5965, the 100% extrapolation of the height of the pattern from the neckline lower.
A break above the 0.6149 (June 13 and 14 high) would invalidate the break and the pattern and possibly indicate a continuation higher instead.
