
GBP/USD Price Analysis: Soars past 1.2900 as USD weakens on soft CPI
- The GBP/USD climbs sharply as US inflation disappoints; UK economy exceeds expectations.
- Technical outlook remains bullish with RSI near overbought, signaling potential for further gains.
- Key resistance levels: 1.2950, 1.2995, and 1.3142; support at 1.2894, 1.2860, and 1.2800 if pullback occurs.
The Pound Sterling extended its gains on Thursday following better-than-expected data from the UK as the economy expanded above estimates. US inflation missed the mark, coming softer a headwind for the Greenback. Therefore, the GBP/USD trades at 1.2927, up 0.62%.
GBP/USD Price Analysis: Technical outlook
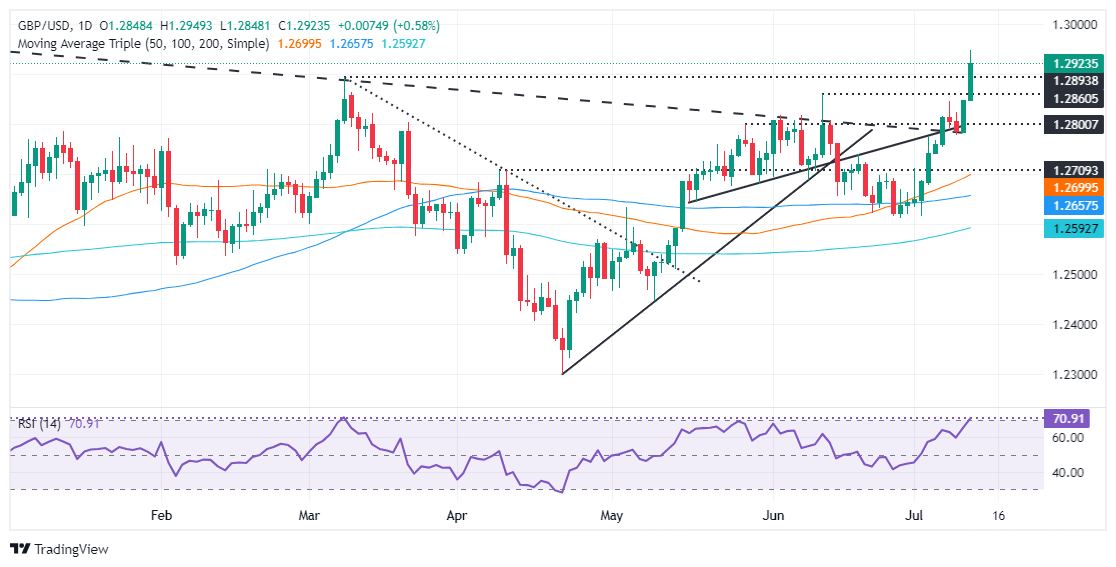
From a technical standpoint, the GBP/USD uptrend remains intact. The pair hit a new year-to-date (YTD) high after clearing the March 8 high of 1.2894.
Momentum favors buyers as the Relative Strength Index (RSI) stands bullish, slightly beneath overbought conditions.
Therefore, if GBP/USD pushes above 1.2950, that could pave the way for testing the July 27, 2023, peak of 1.2995, ahead of testing 1.3000. Further upside is seen once cleared on July 14, 2023, at a high of 1.3142.
On the flip side, if GBP/USD tumbles below 1.2900, the pair could be set for a pullback. The next support would be 1.2894, followed by the June 12 high turned support at 1.2860 and the 1.2800 mark.
GBP/USD Price Action – Daily Chart
British Pound PRICE Today
The table below shows the percentage change of British Pound (GBP) against listed major currencies today. British Pound was the strongest against the US Dollar.
| USD | EUR | GBP | JPY | CAD | AUD | NZD | CHF | |
|---|---|---|---|---|---|---|---|---|
| USD | -0.45% | -0.58% | -1.95% | -0.08% | -0.54% | -0.59% | -0.67% | |
| EUR | 0.45% | -0.12% | -1.50% | 0.37% | -0.09% | -0.13% | -0.22% | |
| GBP | 0.58% | 0.12% | -1.39% | 0.50% | 0.03% | -0.02% | -0.09% | |
| JPY | 1.95% | 1.50% | 1.39% | 1.87% | 1.42% | 1.34% | 1.29% | |
| CAD | 0.08% | -0.37% | -0.50% | -1.87% | -0.48% | -0.51% | -0.59% | |
| AUD | 0.54% | 0.09% | -0.03% | -1.42% | 0.48% | -0.04% | -0.12% | |
| NZD | 0.59% | 0.13% | 0.02% | -1.34% | 0.51% | 0.04% | -0.07% | |
| CHF | 0.67% | 0.22% | 0.09% | -1.29% | 0.59% | 0.12% | 0.07% |
The heat map shows percentage changes of major currencies against each other. The base currency is picked from the left column, while the quote currency is picked from the top row. For example, if you pick the British Pound from the left column and move along the horizontal line to the US Dollar, the percentage change displayed in the box will represent GBP (base)/USD (quote).