
Mexican Peso surges as USD falters on Fed rate cut speculation
- Mexican Peso appreciates following Mexico and US data.
- Banxico minutes reveal potential for interest rate adjustments as inflation is expected to converge by Q4 2025.
- US inflation data misses estimate, pushing US Treasury yields and USDollar Index lower.
- Mixed US data and strong carry trade demand keeping Peso resilient against weakening Greenback.
The Mexican Peso rallies against the US Dollar after the Bank of Mexico (Banxico) revealed its last meeting minutes. Additionally, US inflation data came in softer than expected, opening the door for the Fed to lower borrowing costs. The USD/MXN trades at 17.75, printing losses of 0.43%.
Banxico’s June minutes showed that the board foresees an inflationary environment that may allow for discussing adjustments to interest rates. They acknowledged that the labor market remains robust, yet growth has shown signs of moderation.
Some members project growth to be lower than expected as Mexico’s economic activity has been weak since the end of 2023. Most policymakers mentioned that inflation will converge toward the target in the last quarter of 2025.
Across the border, US Treasury bond yields and the Greenback tanked as US inflation was softer than expected, while the number of Americans filing for unemployment claims came below estimates and the previous reading.
The US Dollar Index (DXY), which tracks the value of a basket of six currencies against the US Dollar, tanks more than 0.50% and is down at 104.41. The US 10-year Treasury note is slipping more than 10 basis points (bps) at 4.17%, a level last seen on March 13, 2024.
Mixed US data helped to cap American currency losses against the Peso, which had remained one of the most sought carry-trade currencies.
Daily digest market movers: Mexican Peso ignores dovish-tilted Banxico minutes
- Banxico’s board members added that services inflation does not show a clear downward trend, which was one of the reasons for keeping rates unchanged at the June meeting.
- They commented that trading conditions experienced significant disruptions and added that the Mexican Peso depreciated considerably.
- Mexico’s June inflation figures were higher than expected due to a rise in food prices when most economists expect Banxico to resume lowering interest rates.
- June US Consumer Price Index (CPI) contracted -0.1% MoM, below estimates of a 0.1% increase. Core CPI ticked lower, down a tenth from 0.2% in May, and the consensus was 0.1% MoM in June.
- In the 12 months to June, headline CPI was 3%, down from 3.3%, and underlying inflation was below estimates, and the previous month’s 3.4% came at 3.3%.
- Initial Jobless Claims for the week ending July 6 missed the mark and came in better than the consensus of 236K at 222K, lower than the previous reading of 239K.
- According to the CME FedWatch Tool data, odds for a September cut are 84%, up from 72% on Wednesday.
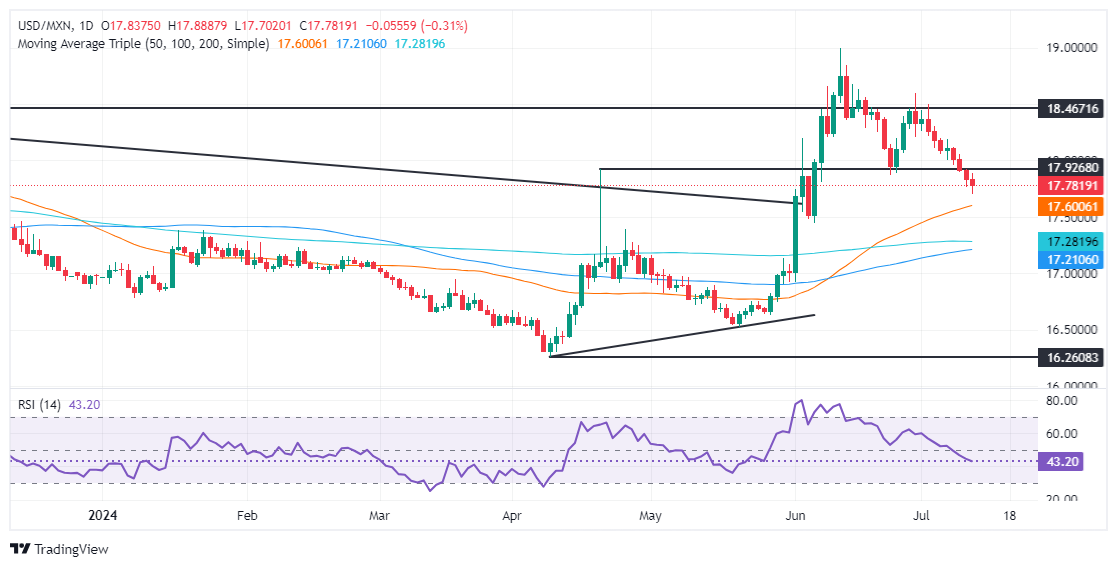
Technical analysis: Mexican Peso edges higher as USD/MXN tumbles below 17.80
The USD/MXN downtrend remains in play, though Thursday’s price action has seen some consolidation within the 17.70-17.90 area. Even though momentum remains bearish, the Relative Strength Index (RSI) flipped flat at bearish territory, hinting that sellers are taking a respite.
In the event of a bearish continuation, bears need to clear the 17.70 mark. Once surpassed, the next stop would be the confluence of the December 5 high and the 50-day Simple Moving Average (SMA) near 17.56/57, followed by the 200-day SMA at 17.26. The next floor level would be the 100-day SMA at 17.19.
Conversely, USD/MXN buyers need to clear the June 24 cycle low of 17.87 turned resistance before challenging the psychological 18.00 figure. Further upside is seen above the July 5 high at 18.19, followed by the June 28 high of 18.59, allowing buyers to challenge the YTD high of 18.99.
Economic Indicator
Consumer Price Index (MoM)
Inflationary or deflationary tendencies are measured by periodically summing the prices of a basket of representative goods and services and presenting the data as The Consumer Price Index (CPI). CPI data is compiled on a monthly basis and released by the US Department of Labor Statistics. The MoM figure compares the prices of goods in the reference month to the previous month.The CPI is a key indicator to measure inflation and changes in purchasing trends. Generally, a high reading is seen as bullish for the US Dollar (USD), while a low reading is seen as bearish.