The Home Depot bests Wall Street consensus despite US consumer weakness

- The Home Depot advances lightly following Q2 beat.
- While retail spending is lagging, management projects rise in annual sales.
- Markets gain after PPI inflation comes in below consensus.
- HD stock features plenty of nearby support that could help propel it upward.
On Monday, the Dow Jones index had trouble waking up for the week
The Home Depot (HD) returned to form on Tuesday after the prior quarter’s weak sales figure arrived below Wall Street’s consensus. This quarter, the second quarter, the home renovation retailer bested the Street’s prediction by nearly half a billion dollars on revenue and by 2.6% on adjusted profits.
Much of the market fodder for conversation on Tuesday revolved around CEO Brian Niccol jettisoning Chipotle Mexican Grill (CMG) in favor of Starbucks (SBUX), which saw its share price explode upward by 22% while Chipotle stock sank in the opposite direction by 12%. In their shadow, Home Depot stock eked out a decent gain of 1.7%.
Also, fellow Dow Jones members Intel (INTC) and Nike (NKE) saw their share prices jump on a lower Producer Price Index inflation print, leading the indices higher as an interest rate cut from the Federal Reserve (Fed) now seems assured in September. At the time of writing, the Dow Jones is up 0.5%, while the S&P 500 gains 1.1% and the NASDAQ advances 1.8%.
The Home Depot earnings news
There was a scare in the premarket after The Home Depot management detailed their pessimistic view of the US consumer. High interest rates and inflation have taken their toll on US shoppers, and The Home Depot is seeing lower spending levels first-hand.
The retailer’s comparable US sales fell 3.6% YoY in Q2 compared to a 2.4% decline consensus. Customer transactions pulled back 1.8% during the quarter to 451 million but rose more than 16% from the first quarter. The second quarter is normally the high point for sales during the year. Average customer receipts likewise decreased 1.3% to $88.90.
But the top and bottom lines saved the day. The Home Depot earned $4.67 in adjusted earnings per share (EPS), 12 cents ahead of consensus. Revenue of $43.2 billion was only slightly above the figure from one year ago but arrived $490 million ahead of dour expectations.
“The underlying long-term fundamentals supporting home improvement demand are strong,” said CEO Ted Decker. “During the quarter, higher interest rates and greater macroeconomic uncertainty pressured consumer demand more broadly, resulting in weaker spend across home improvement projects.”
Despite the decline in comparable sales for the the full year being projected at between 3% and 4%, revenue is set to rise close to 3%. Operating and gross margins are both expected to compress on the margin.
Dow Jones FAQs
The Dow Jones Industrial Average, one of the oldest stock market indices in the world, is compiled of the 30 most traded stocks in the US. The index is price-weighted rather than weighted by capitalization. It is calculated by summing the prices of the constituent stocks and dividing them by a factor, currently 0.152. The index was founded by Charles Dow, who also founded the Wall Street Journal. In later years it has been criticized for not being broadly representative enough because it only tracks 30 conglomerates, unlike broader indices such as the S&P 500.
Many different factors drive the Dow Jones Industrial Average (DJIA). The aggregate performance of the component companies revealed in quarterly company earnings reports is the main one. US and global macroeconomic data also contributes as it impacts on investor sentiment. The level of interest rates, set by the Federal Reserve (Fed), also influences the DJIA as it affects the cost of credit, on which many corporations are heavily reliant. Therefore, inflation can be a major driver as well as other metrics which impact the Fed decisions.
Dow Theory is a method for identifying the primary trend of the stock market developed by Charles Dow. A key step is to compare the direction of the Dow Jones Industrial Average (DJIA) and the Dow Jones Transportation Average (DJTA) and only follow trends where both are moving in the same direction. Volume is a confirmatory criteria. The theory uses elements of peak and trough analysis. Dow’s theory posits three trend phases: accumulation, when smart money starts buying or selling; public participation, when the wider public joins in; and distribution, when the smart money exits.
There are a number of ways to trade the DJIA. One is to use ETFs which allow investors to trade the DJIA as a single security, rather than having to buy shares in all 30 constituent companies. A leading example is the SPDR Dow Jones Industrial Average ETF (DIA). DJIA futures contracts enable traders to speculate on the future value of the index and Options provide the right, but not the obligation, to buy or sell the index at a predetermined price in the future. Mutual funds enable investors to buy a share of a diversified portfolio of DJIA stocks thus providing exposure to the overall index.
Home Depot stock forecast
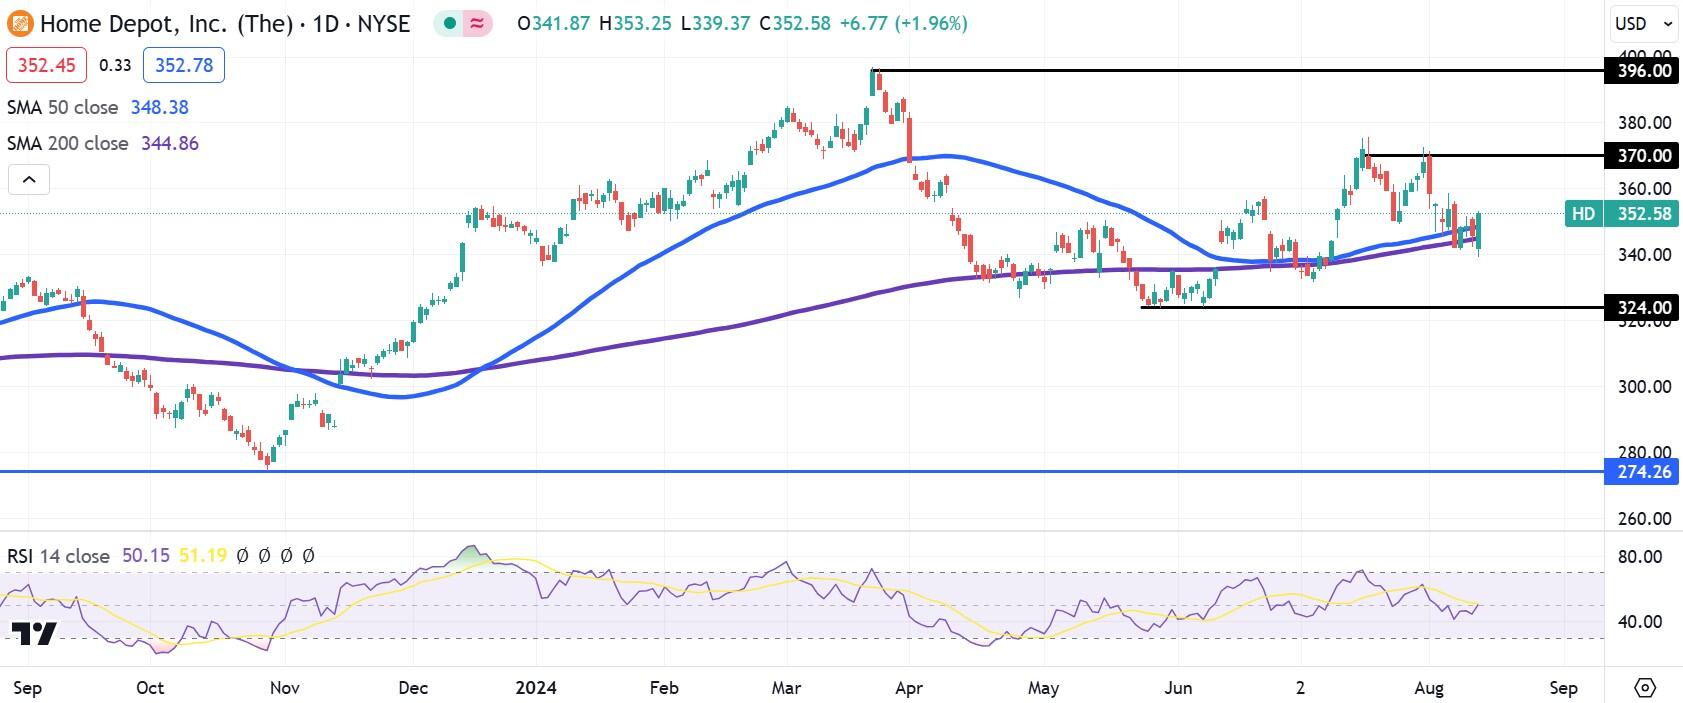
Home Depot stock should benefit from having nearby moving average support. Both the 50-day and 200-day Simple Moving Averages (SMAs) lie just beneath it in the $340s, while HD stock trends at $352. The 50-day SMA had the ability to complete a Death Cross by passing below its 200-day counterpart for most of the past two months but did not take it, an especially positive happening.
With shares lifting away from May’s range low near $324, the Relative Strength Index (RSI) is only at 50, meaning that momentum is neutral. Still, the bad news is largely behind it, and HD stock should trend back up to resistance in the low $370s soon enough.
HD daily stock chart
